Kim-Anh Lê Cao 0000-0003-3923-1116
· mixOmicsTeam
· mixOmicsTeam
Melbourne Integrative Genomics, School of Mathematics and Statistics, University of Melbourne, Australia
· Funded by Grant National Health and Medical Research Council Career Development fellowship (GNT1159458)
Aedin C Culhane 0000-0002-1395-9734
· aedin
· AedinCulhane
Data Science, Dana-Farber Cancer Institute, Boston, MA, USA; Biostatistics, Harvard TH Chan School of Public Health, Boston, MA, USA
· Funded by Chan Zuckerberg Initative, NIH, DoD (need to get grant IDs)
Elana Fertig 0000-0003-3204-342X
· ejfertig
· FertigLab
Department of Oncology, Sidney Kimmel Comprehensive Cancer Center, Johns Hopkins University School of Medicine, Baltimore, MD, USA; Department of Biomedical Engineering, Johns Hopkins University School of Medicine, Baltimore, MD, USA; Department of Applied Mathematics and Statistics, Johns Hopkins University Whiting School of Engineering, Baltimore, MD, USA
· Funded by National Institute of Health, National Cancer Institute; National Institute of Health, National Institute of Dental and Craniofacial Research; Lustgarten Foundation; Emerson Foundation; Allegheny Health Network
Vincent J. Carey 0000-0003-4046-0063
· vjcitn
Channing Division of Network Medicine, Brigham and Women’s Hospital, Harvard Medical School
· Funded by National Institutes of Health, National Human Genome Research Institute; National Institutes of Health, National Cancer Institute; Chan-Zuckerberg Initiative
Michael I. Love 0000-0001-8401-0545
· mikelove
· mikelove
Department of Biostatistics, UNC-Chapel Hill; Department of Genetics, UNC-Chapel Hill
· Funded by National Institutes of Health, National Human Genome Research Institute; National Institutes of Health, National Institute of Mental Health
Guo-Cheng Yuan XXXX-XXXX-XXXX-XXXX
· gcyuan
· gc_yuan
Department of Pediatric Oncology, Dana-Farber Cancer Institute; Department of Pediatrics, Harvard Medical School
· Funded by National Institutes of Health, National Cancer Institute; National Institutes of Health, National Institute on Aging
Al J Abadi 0000-0002-4146-2848
· ajabadi
· aljabadi
Melbourne Integrative Genomics, School of Mathematics and Statistics, University of Melbourne, Australia
· Funded by Chan Zuckerberg initiative (HCA2-A-1708-02277); Australian Research Council (DP200102903)
Casey S. Greene 0000-0001-8713-9213
· cgreene
· greenescientist
Department of Systems Pharmacology and Translational Therapeutics, Perelman School of Medicine, University of Pennsylvania, Philadelphia, PA, USA
· Funded by National Institutes of Health, National Cancer Institute (R01 CA237170); National Institutes of Health, National Human Genome Research Institute (R01 HG010067)
Amrit Singh 0000-0002-7475-1646
· singha53
· asingh_22g
Department of Pathology and Laboratory Medicine, University of British Columbia; PROOF Centre of Excellence
· Funded by Michael Smith Foudation for Health Research; Mitacs
Alexis Coullomb 0000-0003-3164-6640
· alexcoul
· AlexisCoullomb
Toulouse Cancer Research Center (CRCT), INSERM, Université Paul Sabatier III, Toulouse, France
· Funded by INSERM; Fondation Toulouse Cancer Santé; Pierre Fabre Research Institute
Vera Pancaldi 0000-0002-7433-624X
· VeraPancaldi
· VeraPancaldi
Toulouse Cancer Research Center (CRCT), INSERM, Université Paul Sabatier III, Toulouse, France; Barcelona Supercomputing Center, Barcelona, Spain
· Funded by INSERM; Fondation Toulouse Cancer Santé; Pierre Fabre Research Institute
Joshua S. Sodicoff 0000-0001-5182-960X
· jsodicoff
Department of Computational Medicine and Bioinformatics, University of Michigan; Department of Biomedical Engineering, University of Michigan
Joshua D. Welch 0000-0002-5869-2391
· jw156605
· LabWelch
Department of Computational Medicine and Bioinformatics, University of Michigan; Department of Computer Science and Engineering, University of Michigan
· Funded by National Human Genome Research Institute, NIH; National Institute of Allergy and Infectious Diseases, NIH; National Institute of Mental Health, NIH
Emily F. Davis-Marcisak 0000-0001-8624-1013
· edavis71
· efaithd
McKusick-Nathans Institute of the Department of Genetic Medicine, Johns Hopkins School of Medicine, Baltimore, MD, USA
· Funded by National Institute of Health, National Cancer Institute
Matthew E. Ritchie 0000-0002-7383-0609
· mritchie
· mritchieau
Epigenetics and Development Division, The Walter and Eliza Hall Institute of Medical Research; Department of Medical Biology, The University of Melbourne; School of Mathematics and Statistics, The University of Melbourne
· Funded by XX
Yue You 0000-0003-3883-445X
· YOU-k
· YueYou9
Epigenetics and Development Division, The Walter and Eliza Hall Institute of Medical Research; Department of Medical Biology, The University of Melbourne
· Funded by XX
Genevieve L. Stein-O’Brien 0000-0001-8681-9110
· genesofeve
· genesofeve
Department of Oncology, Sidney Kimmel Comprehensive Cancer Center, Johns Hopkins University School of Medicine, Baltimore, MD, USA; Department of Neuroscience, Johns Hopkins University, Baltimore, MD, USA; McKusick-Nathans Institute of the Department of Genetic Medicine, Johns Hopkins School of Medicine, Baltimore, MD, USA; Kavli Neuroscience Discovery Institute, Johns Hopkins University, Baltimore, MD, USA
· Funded by Kavli Neuroscience Discovery Institute; Johns Hopkins Provost Postdoctoral Fellowship
Kris Sankaran 0000-0002-9415-1971
· krisrs1128
Department of Statistics, University of Wisconsin - Madison
· Funded by XX
Ruben Dries 0000-0001-7650-7754
· RubD
Department of Hematology and Oncology, Boston Medical Center; Department of Computational Biomedicine, Boston University School of Medicine; Center for Regenerative Medicine (CReM), Boston University
· Funded by XX
Atul Deshpande 0000-0001-5144-6924
· atuldeshpande
· atulpdeshpande
Department of Oncology, Sidney Kimmel Comprehensive Cancer Center, Johns Hopkins University School of Medicine, Baltimore, MD, USA
· Funded by National Institute of Health
Multi-omics hackathon studies illustrate standards and computational challenges in cell biology
Single-cell multimodal omics has claimed the title of method of the year only six years after single-cell sequencing [1], demonstrating the rapid pace of technological development in biology. Multi-omics technologies provide a unique opportunity to characterize cellular systems at both the spatial and molecular level. While each high-throughput measurement technology can resolve specific biological scales, complementary data integration techniques can reveal multi-scale interactions between modalities. While advances in multi-omics have coincided with the formation of tremendous new data resources and atlas-based initiatives to characterize biological systems, computational techniques and benchmarking strategies to integrate these datasets remains an active area of research.
To determine the optimal methods and new developments required to analyze multi-modal data effectively, we selected hackathon studies focused on data integration for the Mathematical Frameworks for Integrative Analysis of Emerging Biological Data Workshop. The first challenge included spatial molecular profiling. While this technology is rapidly emerging, it often provides lower molecular resolution than its non-spatial counterparts. Integration strategies that merge spatial and omics datasets have the promise to enhance the molecular resolution of spatially resolved profiling. Thus, we designed a hackathon using spatially resolved transcriptional data from seqFISH with corresponding non-spatial single-cell profiling data from the mouse visual cortex [2]. The second challenge dealt with the limited availability of tissue to obtain multiple measurements in samples from identical conditions, raising the question as to whether information can be transferred from datasets between distinct sample cohorts. Therefore, we designed the second hackathon to contain two triple-negative breast cancer cohorts profiled with single-cell proteomics profiling from mass cytometry (CyTOF) [4] and spatial in-situ proteomics from Multiplexed Ion Beam Imaging (MIBI) [5]. In contrast to the previous challenges, the third challenge presented data at different molecular scales but from the same cells to investigate how genetic and epigenetic alterations to DNA drive the transcriptional regulation underlying cellular state transitions. Our third hackathon was designed with scNMT-seq data to obtain concurrent DNA methylation, chromatin accessibility, and RNA expression from the same cells to delineate the regulatory networks that underlie mouse gastrulation [6].
Altogether, the analysis approaches employed to address these hackathons provide a unique opportunity to identify technology-specific challenges and unifying themes across disparate biological contexts, which are essential to effectively leverage multi-omics datasets for new biological knowledge. This article presents the study-specific and common challenges faced during this workshop. We provide guidelines and articulate the needs of technologies, data, tools, and computational methods to model the multi-scale regulatory processes of biological systems.
scRNA-seq + seqFISH as a case study for spatial transcriptomics
Overview and biological question
The first hackathon aimed to leverage the complementary strengths of sequencing and imaging-based single-cell transcriptomic profiling by using computational techniques to integrate scRNA-seq and seqFISH data in the mouse visual cortex. While single cells are considered the smallest units and building blocks of each tissue, they still require proper spatial and structural three-dimensional organization in order to assemble into a functional tissue that can exert its physiological function. In the last decade, single-cell RNA-seq (scRNA-seq) has played a key role in capturing single-cell gene expression profiles, allowing us to map different cell types and states in whole organisms. Despite this remarkable achievement, this technology is based on cellular dissociation and hence does not maintain spatial relationships between single cells. Emerging technologies can now profile the transcriptome of single cells within their original environment, offering the possibility to examine how gene expression is influenced by cell-to-cell interactions and how it is spatially organized. One such approach is sequential single-molecule fluorescence in situ hybridization (seqFISH [7]), which can identify single molecules at (sub)cellular resolution with high sensitivity.
In contrast with scRNA-seq, seqFISH and many other spatial transcriptomic technologies often pose significant technological challenges, resulting in a small number of profiled genes per cell (10-100s). The newer generation of seqFISH technology (called seqFISH+ [9]) has dramatically enhanced its capacity to profile up to 10,000 genes, but this technology is more complex and costly than seqFISH.
New computational approaches are needed to integrate scRNA-seq and seqFISH data effectively. This first hackathon provided seqFISH and scRNA-seq data corresponding to the mouse visual cortex ([3], [2]) and our participants were challenged to accurately identify cell types. The scRNA-seq data included transcriptional profiles at a high molecular resolution whereas the seqFISH data provided spatial characterization at a lower molecular resolution. Two key computational challenges were identified to enable high-resolution spatial molecular resolution. First, we explored several strategies to identify the most likely cell types in the seqFISH dataset based on information obtained from the scRNA-seq dataset. Second, we sought to transfer spatial information obtained from the seqFISH dataset to that of the scRNA-seq dataset. Cell type labels were derived from scRNA-seq analysis [2] and previous seqFISH/scRNA-seq integration [3] were also provided as reference.
Data were preprocessed by the organizers and consisted in 113 matching genes between the scRNA-seq dataset and the seqFISH dataset, with 1723 cells for the scRNA-seq data and 1597 cells for the seqFISH data.
Figure 1:
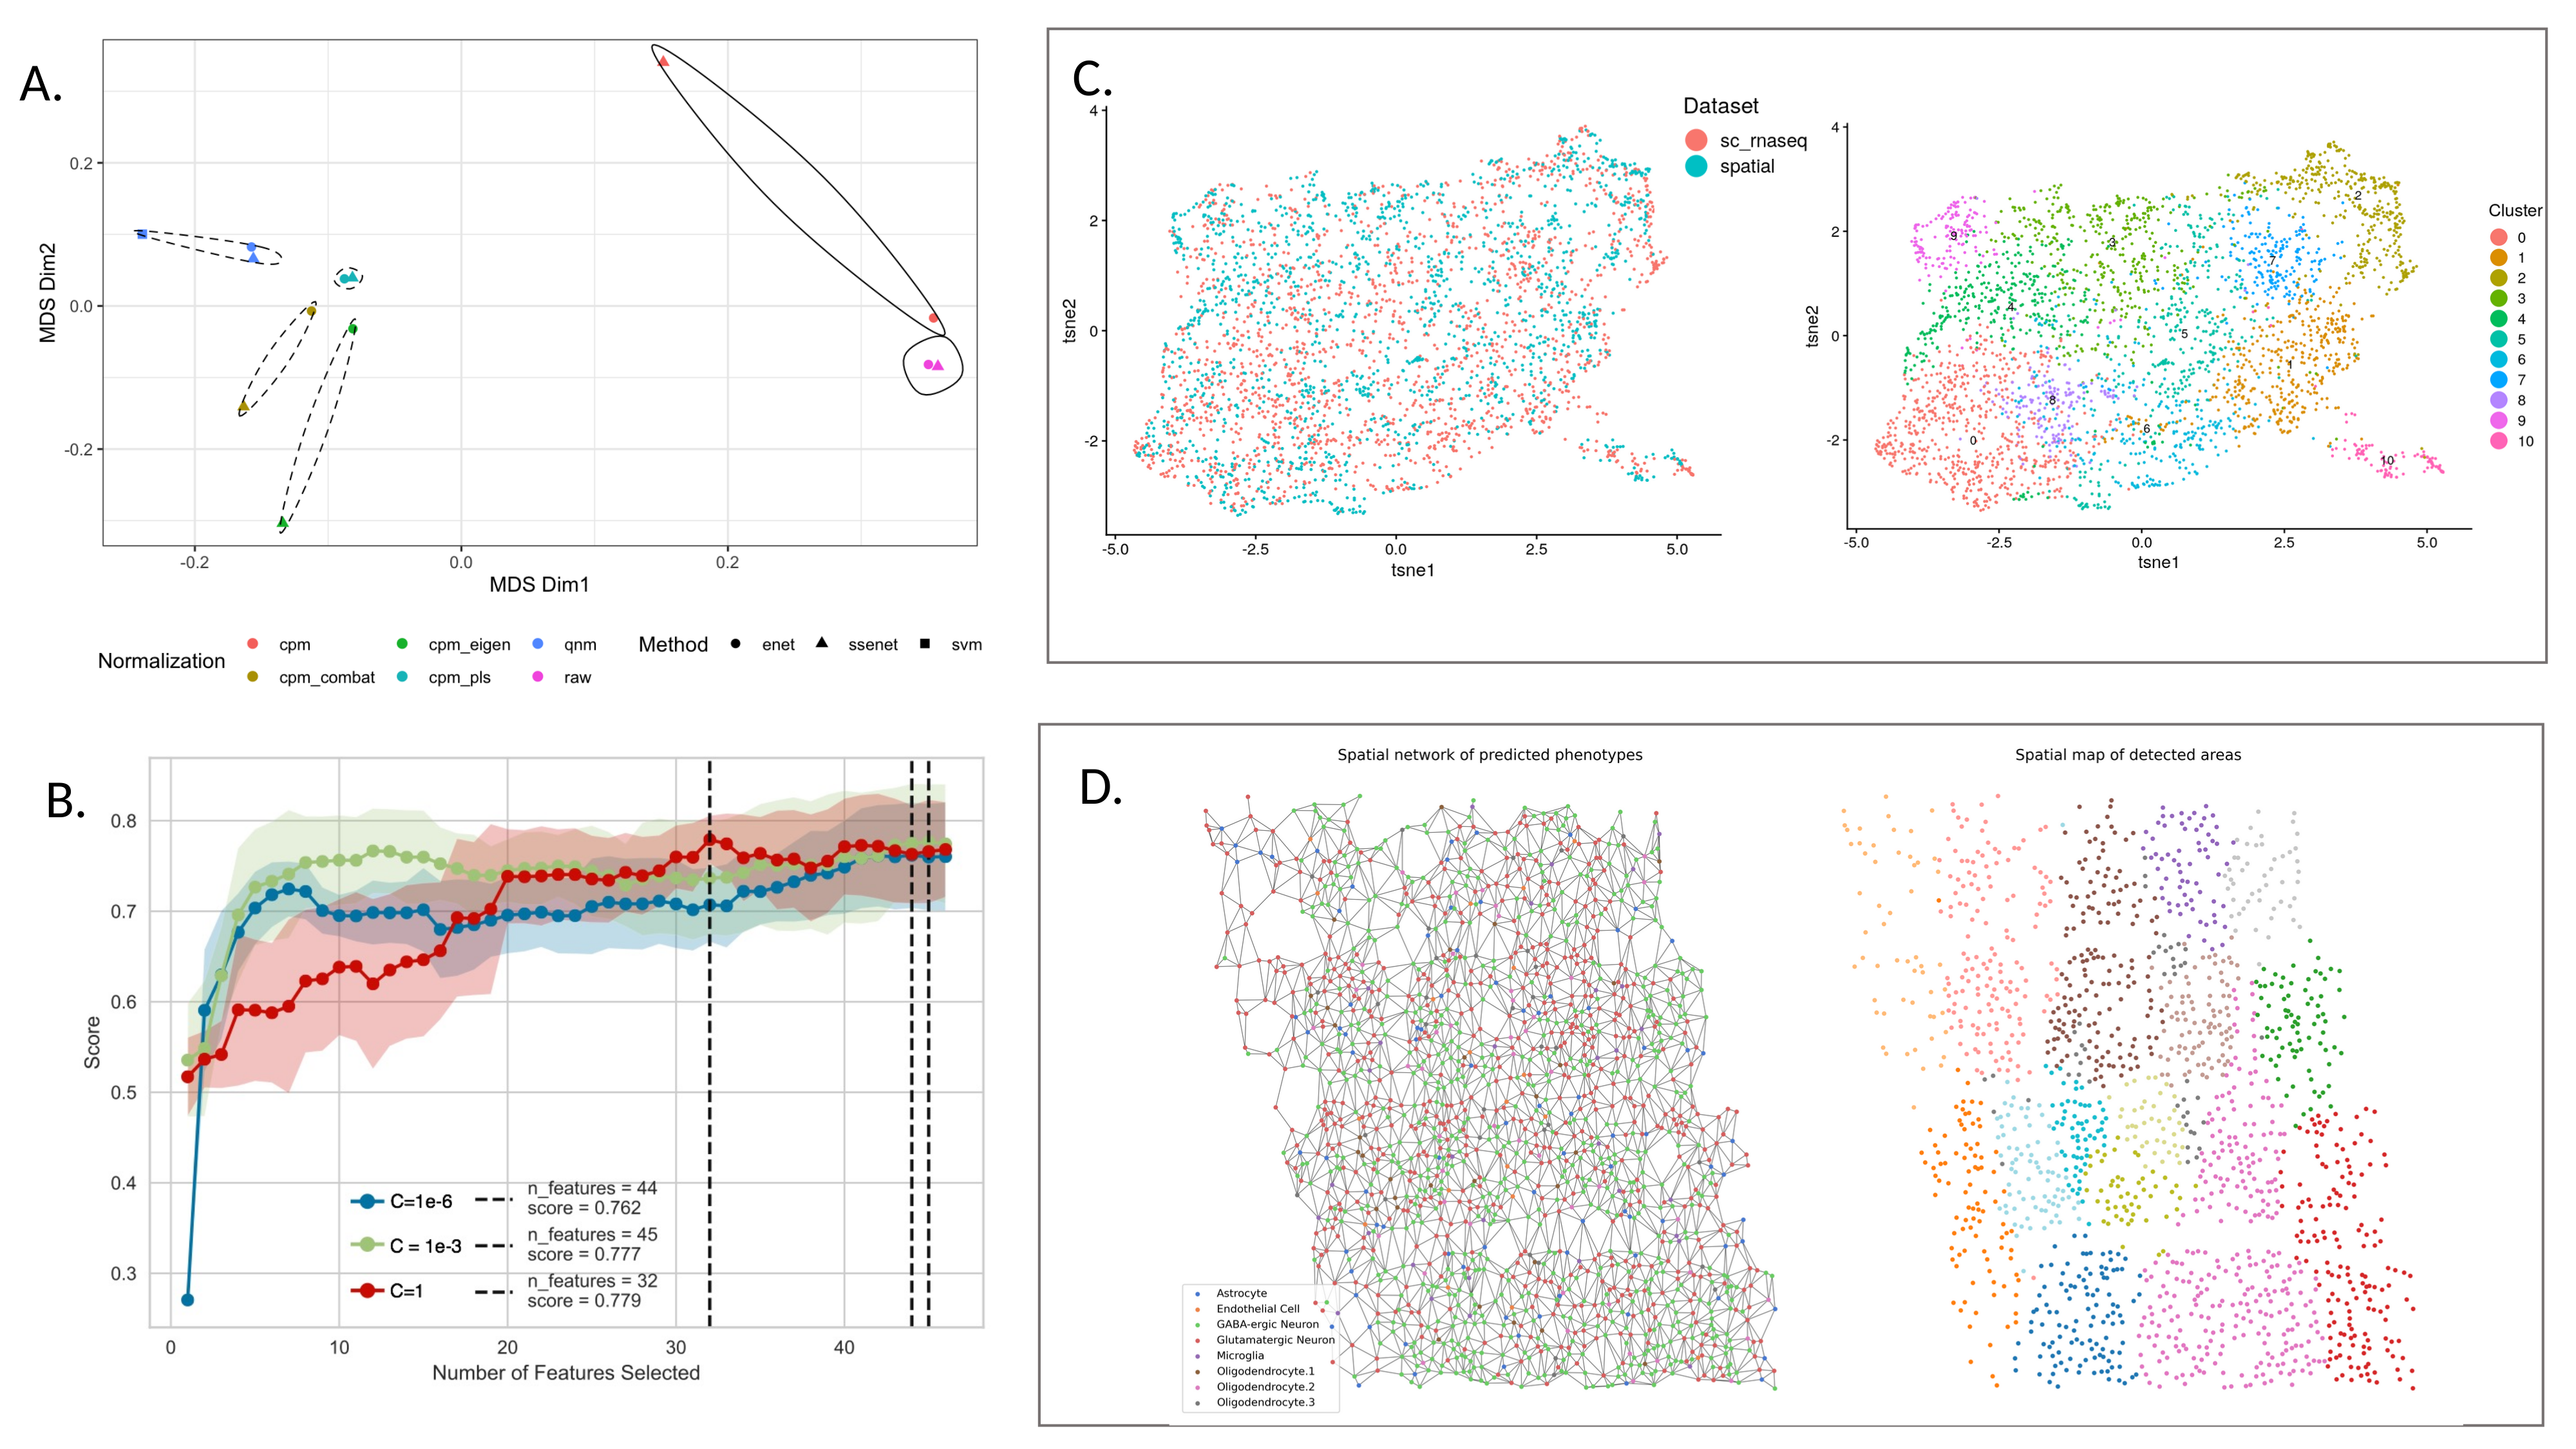
Caption Figure: Overview of seqFISH and scRNA-seq integration analysis.
A. Assessment of cell type prediction using different data normalizations and classifiers. Normalization strategies included none (raw), counts per million (cpm), ComBat batch correction applied to cpm (cpm_combat), scRNA-seq and seqFISH scaled using the first eigenvalue (cpm_eigen), latent variables retained for both datasets after applying Partial Least Squares regression to cpm_eigen normalized data (cpm_pls). Classifiers approaches included a supervised multinomial classifier with elastic net penalty (enet), a semi-supervised multinomial classifier with elastic net penalty (ssenet) and Support Vector Machine (SVM, supervised). Each classifier was trained using the scRNA-seq data and the known (provided) cell type labels, then predicted the cell type labels in the seqFISH data; for the SVM predictions from the original study were used (Challenge 1). Gower distance between each method-normalization pair is depicted on a multidimensional scaling plot. The first dimension (x-axis) separates methods that normalize the scRNA-seq and seqFISH data together (dashed) and separately (solid), showing that normalization had a stronger impact on cell type predictions than the classification method used.
B. SVM classification models with different C parameters were trained with different number of genes in scRNA-seq data using Recursive Feature Elimination (RFE) to evaluate the minimal number of genes required for data integration. The results show that a smaller gene list than what the original study proposed was sufficeint to identify cell types in both data types (Challenge 1).
C. LIGER was applied to combine spatial and single cell transcriptomic datasets. From the separate and integrative analyses, plots of identified and known clusters were generated and metrics of integration performance were compared, showing some loss of information as a result of the integration (Challenge 1).
D. Construction of a spatial network from cells’ positions using Voronoi tessellation, where cell types were inferred from SVM trained on scRNA-seq data. Left: A neighbors aggregation method computes aggregation statistics on the seqFISH gene expression data for each node and its first order neighbors (Challenge 2). Right: Identification of spatially coherent areas that can contain one or several cell types and can be used to detect genes whose expression is modulated by spatial factors rather than cell type.
Computational challenges
Challenge 1: overlay of scRNA-seq onto seqFISH for resolution enhancement
The mouse visual cortex consists of multiple complex cell types. However, the seqFISH dataset was limited to 125 profiled genes, which were not prioritized based on their ability to discriminate between cell types. Assigning the correct cell identity presents an important challenge. In contrast, the scRNA-seq dataset is transcriptome-wide and includes the 125 genes profiled by seqFISH. This challenge proposed to use all genes to identify the cell type labels for each cell in the scRNA-seq data with high certainty. Next, we leveraged the cell type information to build a classifier based on a subset of the 125 genes shared between both datasets. The classifier was then applied to the seqFISH dataset to assign cell types.
During the hackathon, participants aimed to test various machine learning and data integration models (see Vignettes). Preliminary analyses highlighted that normalization strategies had a significant impact on the final results (Figure 1A). In addition, although unique molecular identifier (UMI) based scRNA-seq and seqFISH can both be considered as count data, we observed dataset specific biases that could be attributed to either platform (imaging vs. sequencing batch effects) or sample specific sources of variation. We opted to apply a quantile normalization approach that forces a similar expression distribution for each shared gene.
Two classification approaches were considered: supervised and semi-supervised generalized linear model regularized with elastic net penalty (enet and ssenet) and supervised support vector machines (SVM). The ssenet approach builds a model iteratively: it combines both datasets and initially only retains the highest confidence labels, then gradually adds more cell type labels until all cells are classified (Figure 1A). This type of self-training approach might be promising to generalize information to other datasets. To improve the SVM model, several combinations of kernels and optimal hyperparameters were assessed using a combination of randomized and zoomed search. In addition, different flavors of gene selection using recursive feature elimination were considered to identify the optimal or minimal number of genes needed to correctly classify the majority of the cells (Figure 1A). Finally, different classification accuracy metrics were considered to alleviate the major class imbalance in the dataset. More than 90% of cells were excitatory or inhibitory neurons, using balanced classification error rates. We applied LIGER, an approach based on integrative non-negative matrix factorization (NMF) to integrate both datasets in a subspace based on shared factors. This enabled the transfer of cell type labels using a nearest neighbor approach (Figure 1D).
Challenge 2: Identifying spatial expression patterns at the tissue level through the integration of gene expression and spatial cellular coordinates
While most tools originally developed for scRNA-seq data can be adapted for spatial transcriptomic datasets (see common challenges section), methods to extract sources of variation from spatial factors are still lacking. Novel methods that can integrate the information obtained from gene expression with that of the spatial coordinates from each cell or transcript (for sub-cellular resolution) within a tissue of interest are needed.
To identify spatial expression patterns in the seqFISH dataset, the participants first formed a spatial network based on Voronoi tessellation ([10]). The gene expression of each cell was spatially smoothed by calculating the average gene expression of all neighboring cells. UMAP was applied to the smoothed and aggregated data matrix to identify cell clusters with a density-based clustering approach (Figure 1D). Interestingly, these results showed that the obtained clusters themselves are spatially separated and do not necessarily overlap with specific cell types, suggesting that the spatial dimension cannot be captured from the expression data only.
An unanswered question is whether the identified combinatorial spatial patterns can be extracted directly from scRNA-seq data, as previous studies have shown cellular mapping between gene expression profiles and known spatial locations [11,12]. However, this still constitutes both a technological and analytical challenge that will require careful benchmarking in the near future (see benchmarking section).
Spatial proteomics as a case for cross-study and cross-platform analysis
Overview and biological question
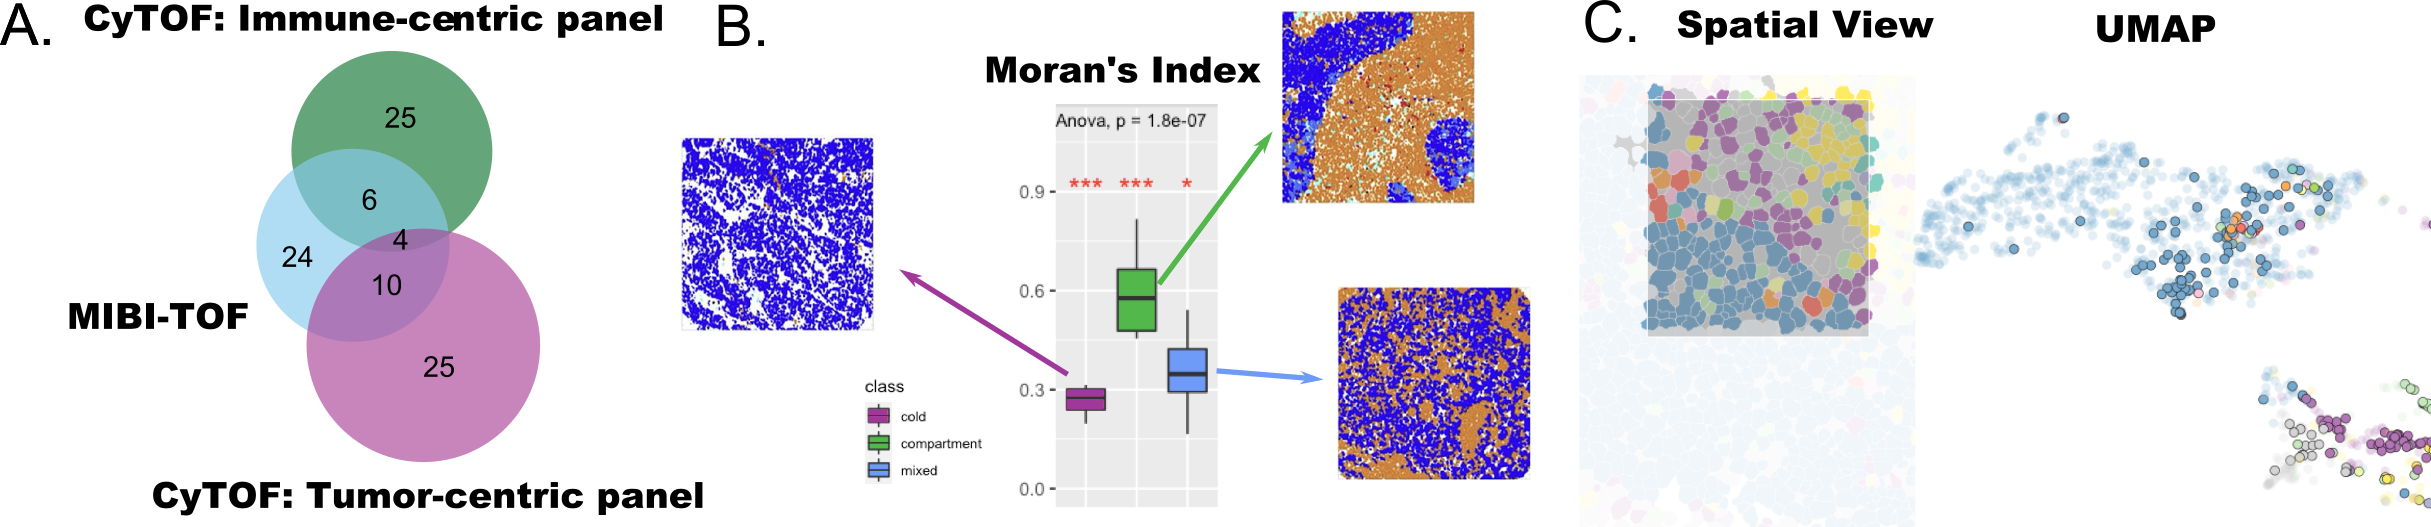
Whereas the first hackathon with seqFISH and scRNA-seq data included samples from the same biological conditions, our second hackathon challenged participants to analyze two datasets obtained from different single cell targeted proteomics (antibody-based) technologies, applied to breast cancer tissue of different patient cohorts, from different laboratories. Both studies examined the tumor-immune microenvironment in primary breast cancer: Wagner, et al. used Mass Cytometry (CyTOF) to assay 73 proteins across two panels (tumor and immune) in 194 tissue samples from 143 subjects, of which 6 patients had triple-negative negative breast cancer [4], while Keren, et al. applied Multiplexed Ion Beam Imaging (MIBI) to quantify spatial in-situ expression of 36 proteins in 41 triple-negative breast cancer patients [5] (Figure 2A).
This hackathon focused on integrative data analysis across studies and platforms, given limited overlap in features (Section @ref{sec:common}). Three main challenges emerged. The first challenge was whether analytical methods could integrate partially-overlapping proteomic data collected on different patients with similar phenotypes, and whether measurements from one technology (MIBI spatial location and expression of proteins) could be transferred and used to predict information in the second technology (e.g., spatial expression patterns of proteins measured on CyTOF). The second challenge pertained to the added value of spatial technologies and whether integrated analyses of spatial single cell data could uncover additional information about immune cell populations in breast cancer beyond cell composition. The third challenge was whether data from patients with heterogeneous phenotypes could still be integrated, given few common features and no overlap in biological samples.
Figure 2:
Caption figure:
A The datasets selected for this hackathon had limited overlap in features (MIBI-TOF, CyTOF immune-centric panel, and CyTOF tumor-centric panel; illustrating Challenge 1)
B Spatial analysis with Moran’s index computed on Gabriel graph shown in boxplot according to tumor/immune status showing a significant difference between groups (Red asterisks indicate significance of an ANOVA of each group with all others with p-value from an overall ANOVA across the three groups reported; exploring Challenge 2).
C Cells can be studied through either spatial or gene expression relationships, and correspondences between both representations can be highlighted through linked brushing, an interactive visualization technique (exploring Challenge 2).
Computational challenges
Challenge 1: Limited overlap between protein features across studies
There were only 20 proteins that were assayed in both the CyTOF [4] and MIBI-TOF [5] studies (Figure 2A), which precluded integration of features at the level of gene set or pathways and required the use of surrogate measures for cross-study association. The majority of proteins were cell-type markers or biomarkers targets of breast cancer therapeutic intervention, providing the opportunity to perform cross-study integration of cell type proportions in tumor tissue samples.
Several semi-supervised and supervised algorithms were applied to transfer cell labels and cell compositions from one dataset to the second (see Vignettes). Random forest was considered to capture the hierarchical structure of cell lineage and perform feature transfer learning of cell type labels, using an adaptation of the prediction strength approach [13] to assess model robustness: first, a model was trained on the labeled dataset, then used to predict labels in the unlabeled dataset; next, a second model was trained based on the second dataset with the newly predicted labels; finally, the ability of the second model to recover the correct original labels when making predictions on the labeled dataset was assessed.
Mapping cells from CyTOF to imaging with spatial information was handled by solving an entropic regularization optimal transport problem [14][15], using the cosine distance of the common proteins between the two datasets as transport cost. The constructed optimal transport plan can be considered as likelihood of cells from one modality mapped to cells from the other modality, which allows the prediction of protein expression measured only in CyTOF on imaging data. After cluster analysis of the resulting imputed expression matrix, sub tumour cell type could be identified that was not revealed in the original matrix.
Another issue encountered with this challenge was that the different scales of protein expression across technologies meant that cell compositions could not be integrated using correlation of the expression of protein markers, as some cell markers were expected on a range of cell types (e.g. CD45), while others were more specialized and appeared in only a subset of those cells (e.g. CD4). Other challenges associated with cell composition analysis of proteomics data included uncertainty about antibody specificity and consistency between studies; specific sensitivity and specificity of protein markers for cell types and tissues; and disease heterogeneity. Cell type assignment was also a significant challenge, as it relied on manually curated protein annotation, and was therefore dependent on domain-specific knowledge (e.g. CD4 is expressed by T-cells). To date, methods for cell type assignment, classification or extraction of differentially expressed proteins cannot easily be applied to targeted proteomics. There is thus an urgent need for a unifying map between cells present in different datasets, and for annotation resources to provide quality metric or priors of protein cell type markers. The construction of protein expression atlases would support cell type classification, even if antibodies used and their performances might vary between labs.
Challenge 2: spatial analysis of protein expression
CyTOF mass spectrometry data provided protein expression and counts/composition of cells in breast tumor-immune environment, while the MIBI-TOF data provided spatial information that quantified cell attributes (shape, size, spatial coordinates) in addition to expression levels. These two data sets thus provide the opportunity to examine protein expression, cell microenvironment, and predict cell-cell interactions and the cellular community ecosystem.
Spatial information can be encoded as a set of XY coordinates (cell centroid), a line (e.g. tumor-immune boundary), or a polygon, which is a closed plane defined by a number of lines and can define complex shapes such as a cell or a community of cells. Spatial protein expression can be summarized using spatial descriptive statistics, such as the autocorrelation of the expression of a protein within a neighborhood of polygons, using techniques developed in geographical information science or ecology to assess whether a spatially measured variable has a random, dispersed or clustered pattern [16].
We investigated whether expression data could be used to predict spatial properties of tissue samples using a variety of approaches (see Vignettes). A K-nearest neighbor graph was used to build spatial response variables and random forest model trained from expression data to predict spatial features. A topic model was trained on protein expression of CyTOF and MIBI-TOF data to predict cell co-locations of CyTOF immune cells where 10% of MIBI-TOF considered test data. Among the five topics identified, the first topic was dominated in most of the immune cells from CyTOF data and the other four dominated in all other cells. Prognostic performance of different higher level spatial metrics was also examined using Moran’s Index with a sphere distance, cell type localisation using nearest neighbour correlation, or cell type interaction composition with Ripley’s L-function. Cox models with fused lasso penalty and random forest survival models were then fitted based on clinical features such as tumor stage, tumor grade, age and tumor size, as well as cell type composition. The spatial metrics were found to be predictive, especially in triple negative breast cancer where clinical features such as grade are often poor prognostics. Further investigation of Moran’s Index using a graph-based neighborhood measure (Gabriel graph, based on Delaunay triangulation; as opposed to sphere distance) found the values of this metric differed significantly between the three prognostic tumor scores described by [5](Figure 2B). This challenge demonstrated the prognostic potential of spatial single cell proteomics data and underscores the need to develop new spatial measures specifically for these data.
Challenge 3: Fourth corner Integration of data at the level of phenotype
Cross-study integration also raises the challenge of non-overlapping biological samples but with similar phenotypes. Here the aim was to identify biomarkers from the different data types to predict phenotype, and, more importantly, to explore concordance among markers selected across multiple studies and datasets. Depending upon how well these markers can be transferred across datasets, as well as the amount of distinctive information encoded by different markers, integrating datasets with only some overlap in markers could potentially provide more biological insight than from individual ‘omics studies. To consider this third challenge, phenotypic data (such as the cell attributes) were the critical factors that should be used to link the two datasets (Figure 4D).
Integrating patient phenotype measures such as grade, stage and overall survival is one first step that we were able to achieve. However, integrating proteins from data sets that used different approaches to cell type annotation and had limited proteins in common was extremely challenging. Borrowing from ecology and the French school of ordination, this problem can be described as a case of the fourth corner problem (or RLQ, Figure 4D). Briefly, given two ’omics data where both features and samples are non overlapping, and phenotypical data are available for each omics data, multiplying the two phenotypical factors should derive a bridging matrix that links the features of two omics data. This requires the two phenotypical matrices to be multiplicable, i.e. describing the same phenotypical factors. The fourth corner RLQ can be solved using matrix decomposition [17; doi:10.1111/ecog.02302]. However, this approach was not attempted in this hackathon.
scNMT-seq as a case-study for epigenetic regulation
Overview and biological question
scRNA-seq technologies have enabled the identification of transcriptional profiles associated with lineage diversification and cell fate commitment [18], but the role of epigenetic layers still remains poorly understood [19]. In contrast to the first two hackathons, which leveraged datasets from complementary technologies to enable high molecular and spatial resolution of biological systems, the third hackathon used datasets spanning disparate molecular scales (e.g. DNA and RNA measurements) to improve our understanding of cell fate decisions using scNMT-seq.
scNMT-seq is one of the first experimental protocols that enable simultaneous quantification of RNA expression and epigenetic information from individual cells [20]. Briefly, cells are incubated with a GpC methyltransferase enzyme that labels accessible GpC sites via DNA methylation. Thus, GpC methylation marks can be interpreted as direct read-outs for chromatin accessibility, whereas CpG methylation marks can be interpreted as endogenous DNA methylation. By physically separating the genomic DNA from the mRNA, scNMT-seq can profile RNA expression, DNA methylation and chromatin accessibility read-outs from the same cell. This third hackathon focused on data integration strategies to detect global covariation between RNA expression and DNA methylation variation from scNMT-seq data in a mouse gastrulation study [21].
Gastrulation is a major lineage specification event in mammalian embryos that is accompanied by profound transcriptional rewiring and epigenetic remodeling [6]. In this study, four developmental stages were profiled, spanning exit from pluripotency to germ layer commitment (E4.5 to E7.5). For simplicity in this hackathon, we focused on the integration of RNA expression and DNA methylation, quantified over the following genomic contexts: gene bodies, promoters, CpG islands, and DHS open sites. A total of 799 cells passed quality control (Figure 3A). Preliminary analyses using dimensionality reduction methods confirmed that all four embryonic stages could be separated on the basis of RNA expression (Figure 3B). The main challenge was to leverage the multi-faceted nature of measurements to better resolve the single-cell subpopulations from distinct embyonic stages.
Computational challenges
Our participants considered 3 computational strategies (see Vignettes): MOSAIC (Multi-Omics Supervised Integrative Clustering algorithm inspired by survClust[22]) classifies samples by creating weighted distance matrices across data modalities, where the weights are defined as the maximum of the ratio of cluster specifc vs. population log likelihoods (Figure 3C). LIGER is an unsupervised non-negative matrix factorization model for manifold alignment that assumes a common feature space by aggregating DNA methylation over gene-centric elements (promoters or gene bodies) but allows cells to vary between data modalities [12] (Figure 3D). Multi-block sparse Projection to Latent Structures (multiblock sPLS), is a sparse generalization of canonical correlation analysis that maximizes paired covariances between the RNA data set and each of the other genomic context data sets [23 [24] (Figure 3E).
Figure 3:
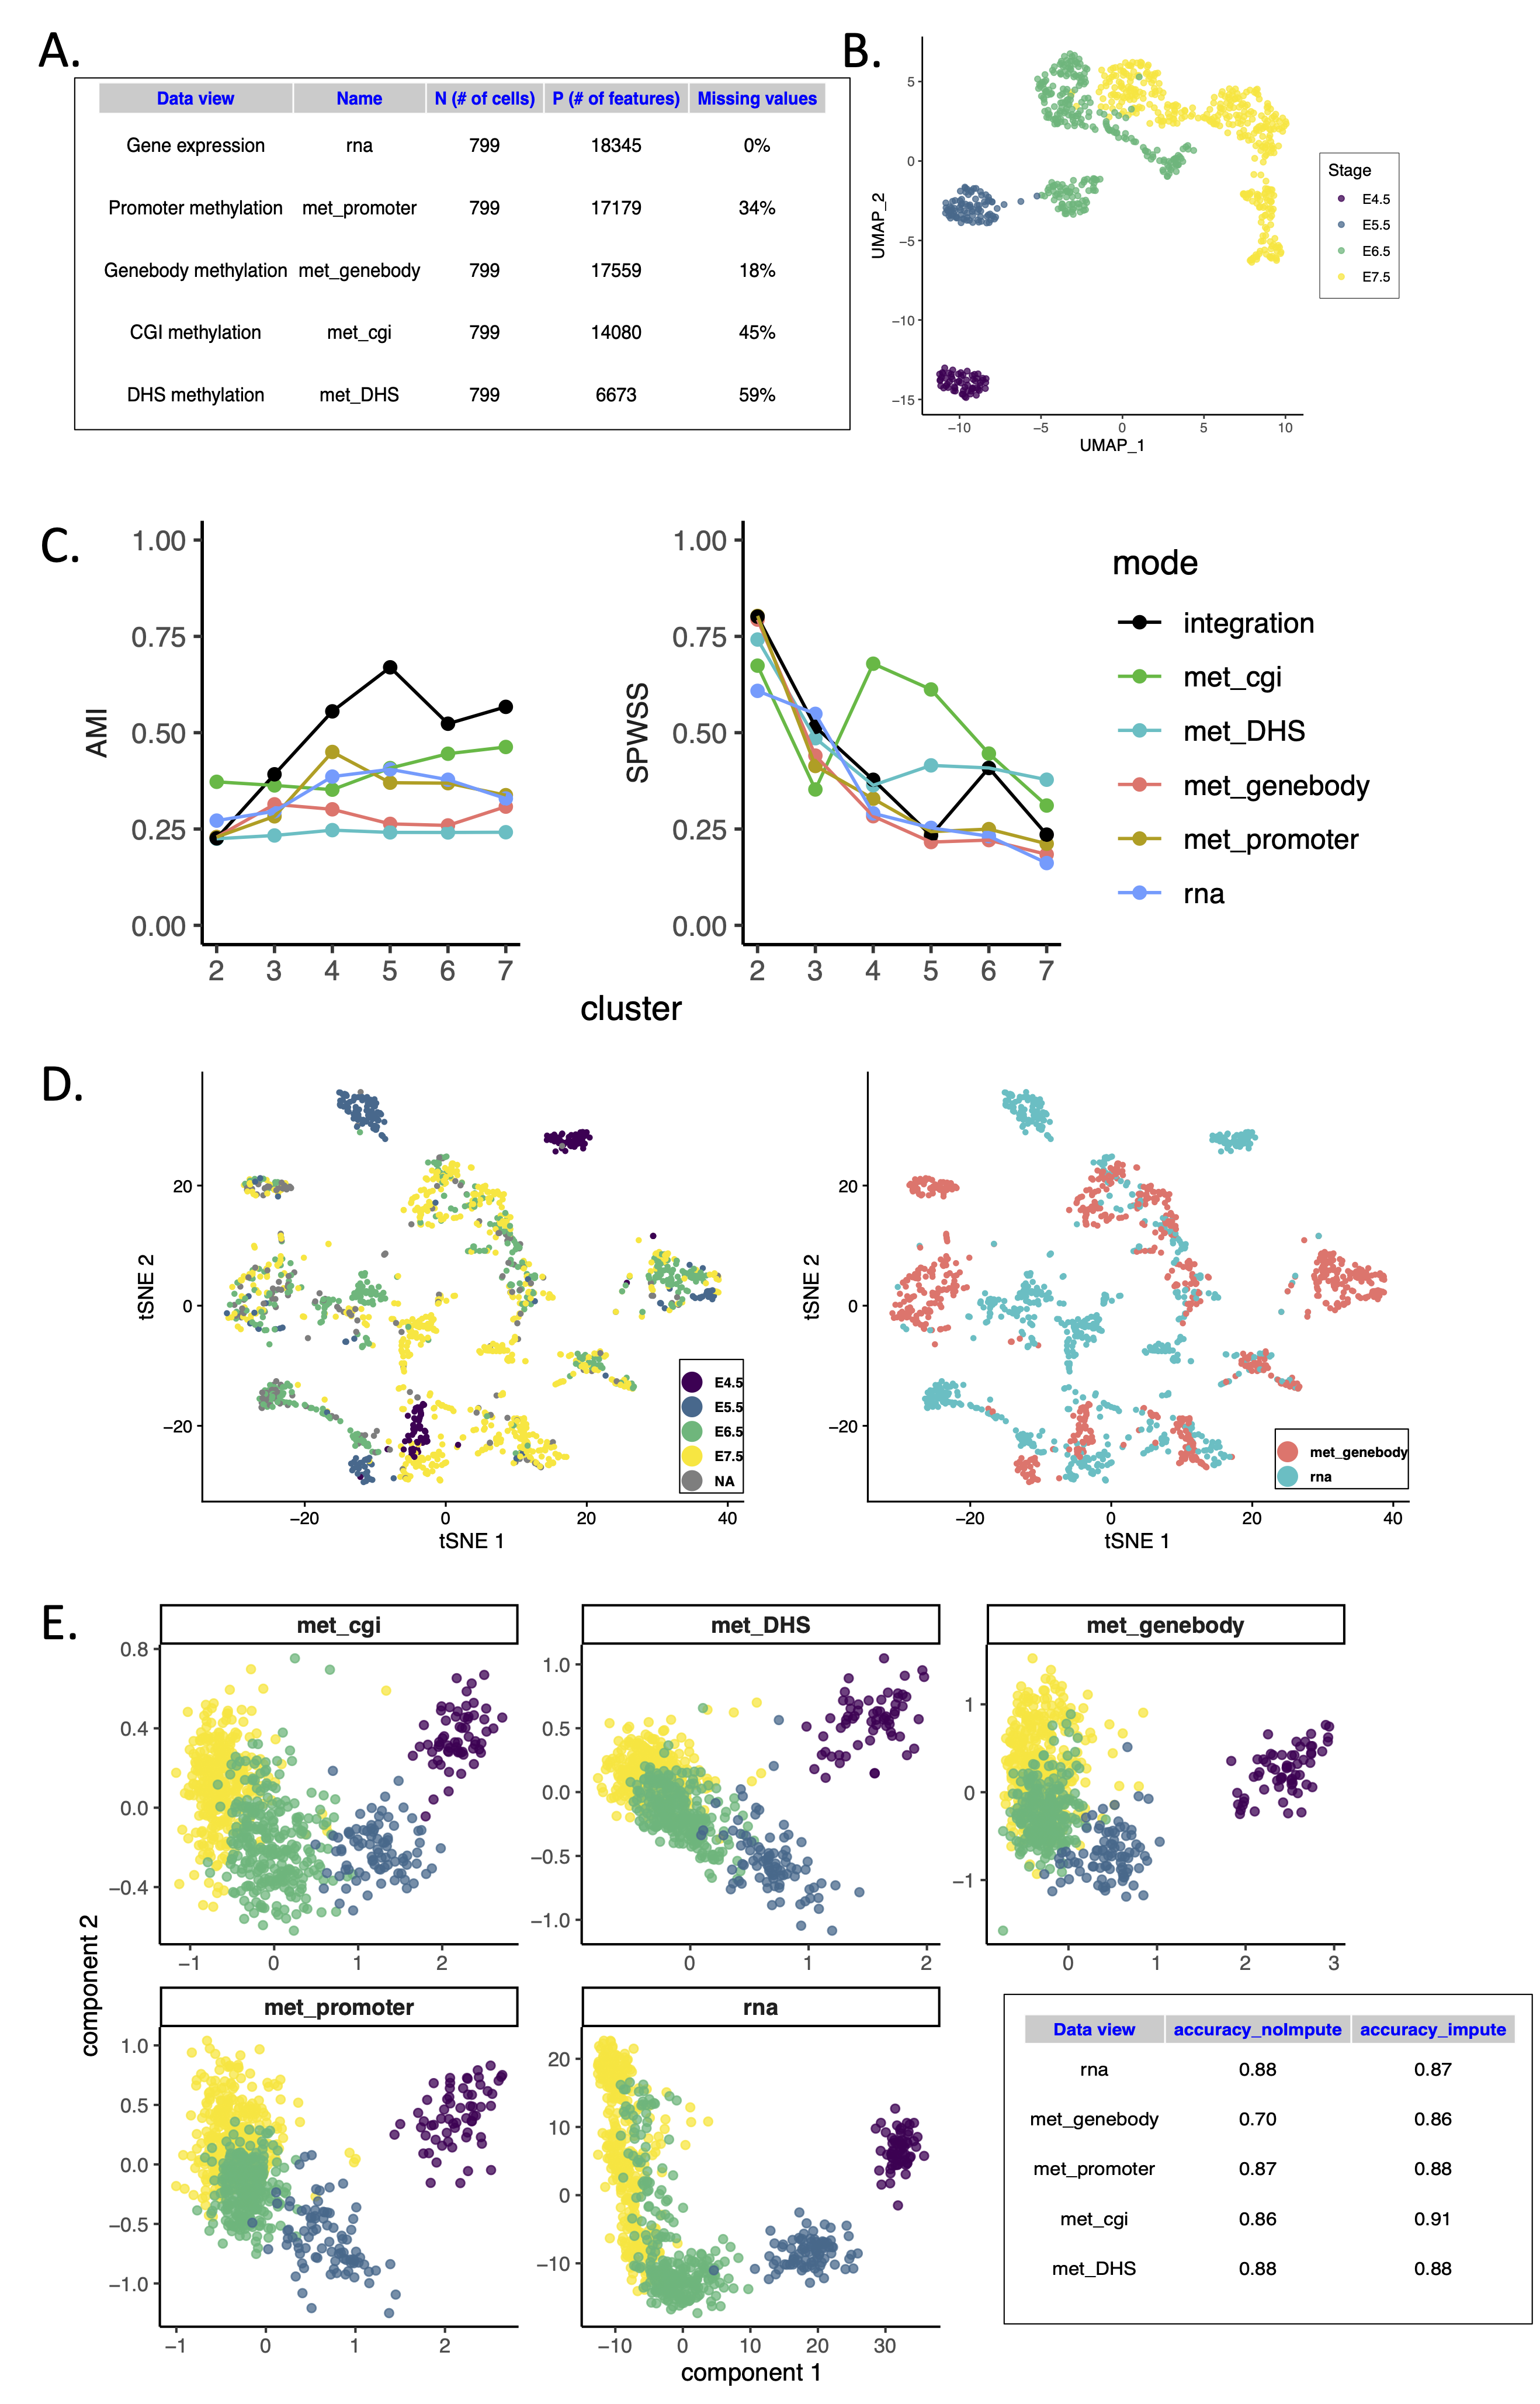
Caption Figure: Overview of hackathon analyses for the scNMT-seq challenge.A Summary of the data modalities analyzed, including different putative regulatory regions.
B UMAP of RNA measurements using 671 highly variable genes shows separation of the four embryonic stages. C Supervised analysis using view-specific and integrative distance measures with MOSAIC: The integration identifies five clusters of cell populations based on Adjusted Mutual Information and Standardized Pooled Within Sum of Squares that outperforms individual (single omics) analyses. D LIGER joint alignment using gene body methylation and RNA expression: cells are colored by stage (left) or original data modality (right).
E Unsupervised integration using multiblock sPLS: cells are projected into the space spanned by each data view components that are maximally correlated. For performance assessment, two types of analyses were considered, either by omitting the missing DNA methylation values or incorporating imputed values. K-means clustering analysis based on the multiblock sPLS components was used to calculate balanced accuracy measures.
Challenge 1: defining genomic features
The first challenge presented in this hackathon concerns the definition of the input data. The output of single-cell bisulfite sequencing are binary DNA methylation measurements for individual CpG sites. Integrative analysis at the CpG level is extremely challenging due to the sparsity levels, the binary nature of the read-outs, and the intricacy in interpretation of individual dinucleotides. To address these problems, DNA methylation measurements are typically aggregated over pre-defined sets of genomic elements (i.e. promoters, enhancers, etc.). This preprocessing step reduces sparsity, permits the calculation of binomial rates that are approximately continuous and can also improve interpretability of the model output.
We observed remarkable differences between genomic contexts on the integration performance. In MOSAIC, stages are better separated when using DNA methylation measurements on promoter regions and at least four clusters (AMI=0.45). Interestingly, this setting performed better than using RNA expression alone (AMI=0.40). Notably, when using an integrated solution across data modalities, stages were better classified (AMI = 0.68) (Figure 3C). LIGER, that was also applied in the first hackathon requires a common feature space to perform alignment of cells when profiled for different data modalities. This hackathon provides unambiguous cell matching between the data modalities and thus represents a gold standard for testing this approach. LIGER was applied to gene expression and gene body methylation: the poor alignment suggested a complex coupling of gene expression and gene body methylation during gastrulation (Figure 3D). Finally, multiblock sPLS identified covarying components between RNA expression and DNA methylation that separated cell stages in all putative regulatory contexts considered (Figure 3E). Taken altogether, these results confirmed that the appropriate selection of the feature space is critical for a successful integration with RNA expression.
Challenge 2: Missing values in DNA methylation
Single-cell bisulfite sequencing protocols are limited by incomplete CpG coverage because of the low amounts of starting material. Nonetheless, in contrast to scRNA-seq, missing data can be distinguished from dropouts. Integrative methods can be divided into approaches that can handle missing values (e.g. MOSAIC, multiblock sPLS which omit the missing values during inference), or approaches that require a priori imputation (e.g. LIGER). In this hackathon, missing values were imputed using nearest neighbor averaging (as implemented in the impute package [25]) in the methylation data.
We compared the integration performance of multiblock sPLS either with original or with imputed data. The missing values were inferred using nearest neighbor averaging (as implemented in the impute package [25]) in the methylation data. The components associated to each data set showed varying degree of separation of the embryonic stages, depending on the genomic contexts (Figure 3E). Accuracy measures based on k-means clustering analysis on the multiblock sPLS components showed that gene body methylation components were better at characterizing embryonic stage after imputation (from 70% with original data to 86% after imputation).
Missing values in regulatory context data represent a topical challenge in data analysis, and further methodological developments are needed to either handle and accurately estimate missing values.
Challenge 3: Linking epigenetic features to gene expression
One of the main advantages of scNMT-seq is the ability to unbiasedly link epigenetic variation with gene expression. Transcriptional activation is associated with specific chromatin states near the gene of interest. This includes deposition of activatory histone marks such as H3K27ac, H3K4me3 and H3K36me3, binding of transcription factors, promoter and/or enhancer demethylation and chromatin remodeling. All these events are closely interconnected and leave a footprint across multiple molecular layers that can only be (partially) recovered by performing an association analysis between a specific chromatin read-out and mRNA expression. However, given the large amount of genes and regulatory regions, this task can become prohibitively large, with the associated multiple testing burden. In addition, some of our analyses have shown that the correlations between epigenetic layers and RNA expression calculated from individual genomic features can be generally weak or spurious.
A practical and straightforward approach from a computational perspective involves considering only putative regulatory elements within each gene’s genomic neighborhood. Nonetheless, this might miss important links with regulatory elements located far away from the neighborhood.
In recent years, chromosome conformation capture experiments, have uncovered a complex network of chromatin interactions inside the nucleus connecting regions separated by multiple megabases along the genome and potentially involved in gene regulation. Early genome-wide contact maps generated by HiC uncovered domains spanning on the order of 1 Mb (in humans) within which genes would be coordinately regulated. Thus, a second strategy to associate putative regulatory elements and genes is to build on existing promoter-centered chromatin contact networks to restrict the association analysis to putative regulatory elements that are in 3D contact with genes.
Although this is a promising strategy to reduce the complexity of the association analysis, most of our 3D interaction datasets are produced in bulk samples and it is so far unclear how much of these structures are preserved across individual cells. While single-cell conformation capture experiments remain limited by data sparsity and high levels of technical noise, we envision that technological advances in this area will deepen our understanding of the regulatory roles of chromatin states.
Commonalities between analytical multi-omics approaches for hackathons
Each hackathon study highlighted disparate challenges to multi-omics from different measurement technologies. Yet, these studies were unified by the underlying problem of data integration. We summarize the common problems faced across all hackathons and shared approaches adopted by participants. These commonalities highlight the critical computational issues in multi-omics single-cell data analysis.
The choice of methods mostly relied on the biological question to address: data integration was conducted using projection approaches, cell prediction required machine or statistical learning methods (SVM, Enet), and spatial analysis was conducted using Hidden Markov random field or Moran’s Index. As computational methodologies span technologies, so do the central challenges highlighted in each hackathon. For example, the accuracy of the analysis critically depended on data pre-processing (e.g. normalization, upstream feature selection), differences in scale across data sets, and overlap (or lack thereof) of features (Figure 4). In many cases, preprocessing can yield data mapping to common molecular features, such as genes, that can be the focus of the integration task. However, the spatial proteomics challenge showed that many multi-omics datasets have limited shared features between studies. In cross-study and cross-platform analyses, methods that investigate hierarchical structure and apply measures of higher order concordance among the omics, cell, and phenotype layers are critical. Even in cases with matching molecular features, such analyses can reveal novel aspects of biology.
The Table summarizes the main methods that were applied across all hackathons. A large number of computational analysis methods that were applied derive from bulk RNA-seq literature, with the exception of projection methods developed for single-cell such as tSNE, UMAP, and LIGER. In this section, we briefly highlight the three common challenges faced across all hackathons, whose reproducible vignettes are in this article.
Common challenge 1: Dependence on pre-processing method and/or variable selection
Pre-processing steps strongly affect downstream analyses. Our participants thoroughly assessed the effect of normalization and data transformation (e.g. spatial transcriptomics, Figure 1A), as well as preliminary feature selection (mostly on based on highly variable genes) or feature summarization (scNMT-seq study). Ease of comparisons between analyses was facilitated by providing processed input data (see software section), which still encountered reproducibility issues between the original published study and the new analyses. For example, in the spatial transcriptomics study, 19 genes were selected in the seqFISH data on one analysis, whereas the original paper selected 43 genes based on the same feature selection process [3]. No consensus was reached across participants’ analyses regarding the best way to process such emerging data, as those would require extensive benchmark, ground truth, or established biological results are yet available, which we discuss in benchmarking.
Common challenge 2: Managing differences in scale and size across datasets
Various techniques were used to address the differences in scale or resolution across data sets. For spatial transcriptomics and proteomics, participants focused on a common set of genes (via feature selection in spatial transcriptomics) or proteins. The scNMT-seq study that included overlap between cells raised the issue of differences in data set size with a varying number of features per dataset ranging from 6,673 to 18,345 (Figure 3A). Some projection-based methods, such as MOFA [26], require a similar number of features in each data set, while others such as PLS / sGCCA [23] do not have this limitation and enable more flexible analysis. Differences in data scale may result in one data set contributing to either too much variation or noise during data integration. Techniques such as re-scaling, batch effect removal approaches, such as Combat [27] or weighting specific data sets, were considered and each offered further improvement in the analyses.
Common challenge 3: Addressing partial overlap of information across cells or features
The degree of feature or cell overlap between datasets varied dramatically within each study. Intuitively, to integrate information across modalities, at least one type of overlap (whether on the features or cells, Figure 4) is required. The field has made progress in developing methods to integrate data sets across the same (bulk) samples of single cells, mostly based on dimension reduction techniques. Amongst them, NMF (LIGER) and Projection to Latent Structures (sGCCA [23]) were used for the scNMT-seq study. When there was no cell overlap, such as in the spatial studies, imputation methods were used to predict gene, protein, or spatial expression values based on nearest neighbors, latent variables, or optimal transport. These methods were also used to predict cell types. The most challenging study was the spatial proteomics, which raised the issue of no overlap between cells or features - the so called fourth corner that relies on phenotypes (Challenge 3 in proteomics). We anticipate that this scenario will be avoided once technological progress and increase in data availability is achieved [28].
Figure 4:
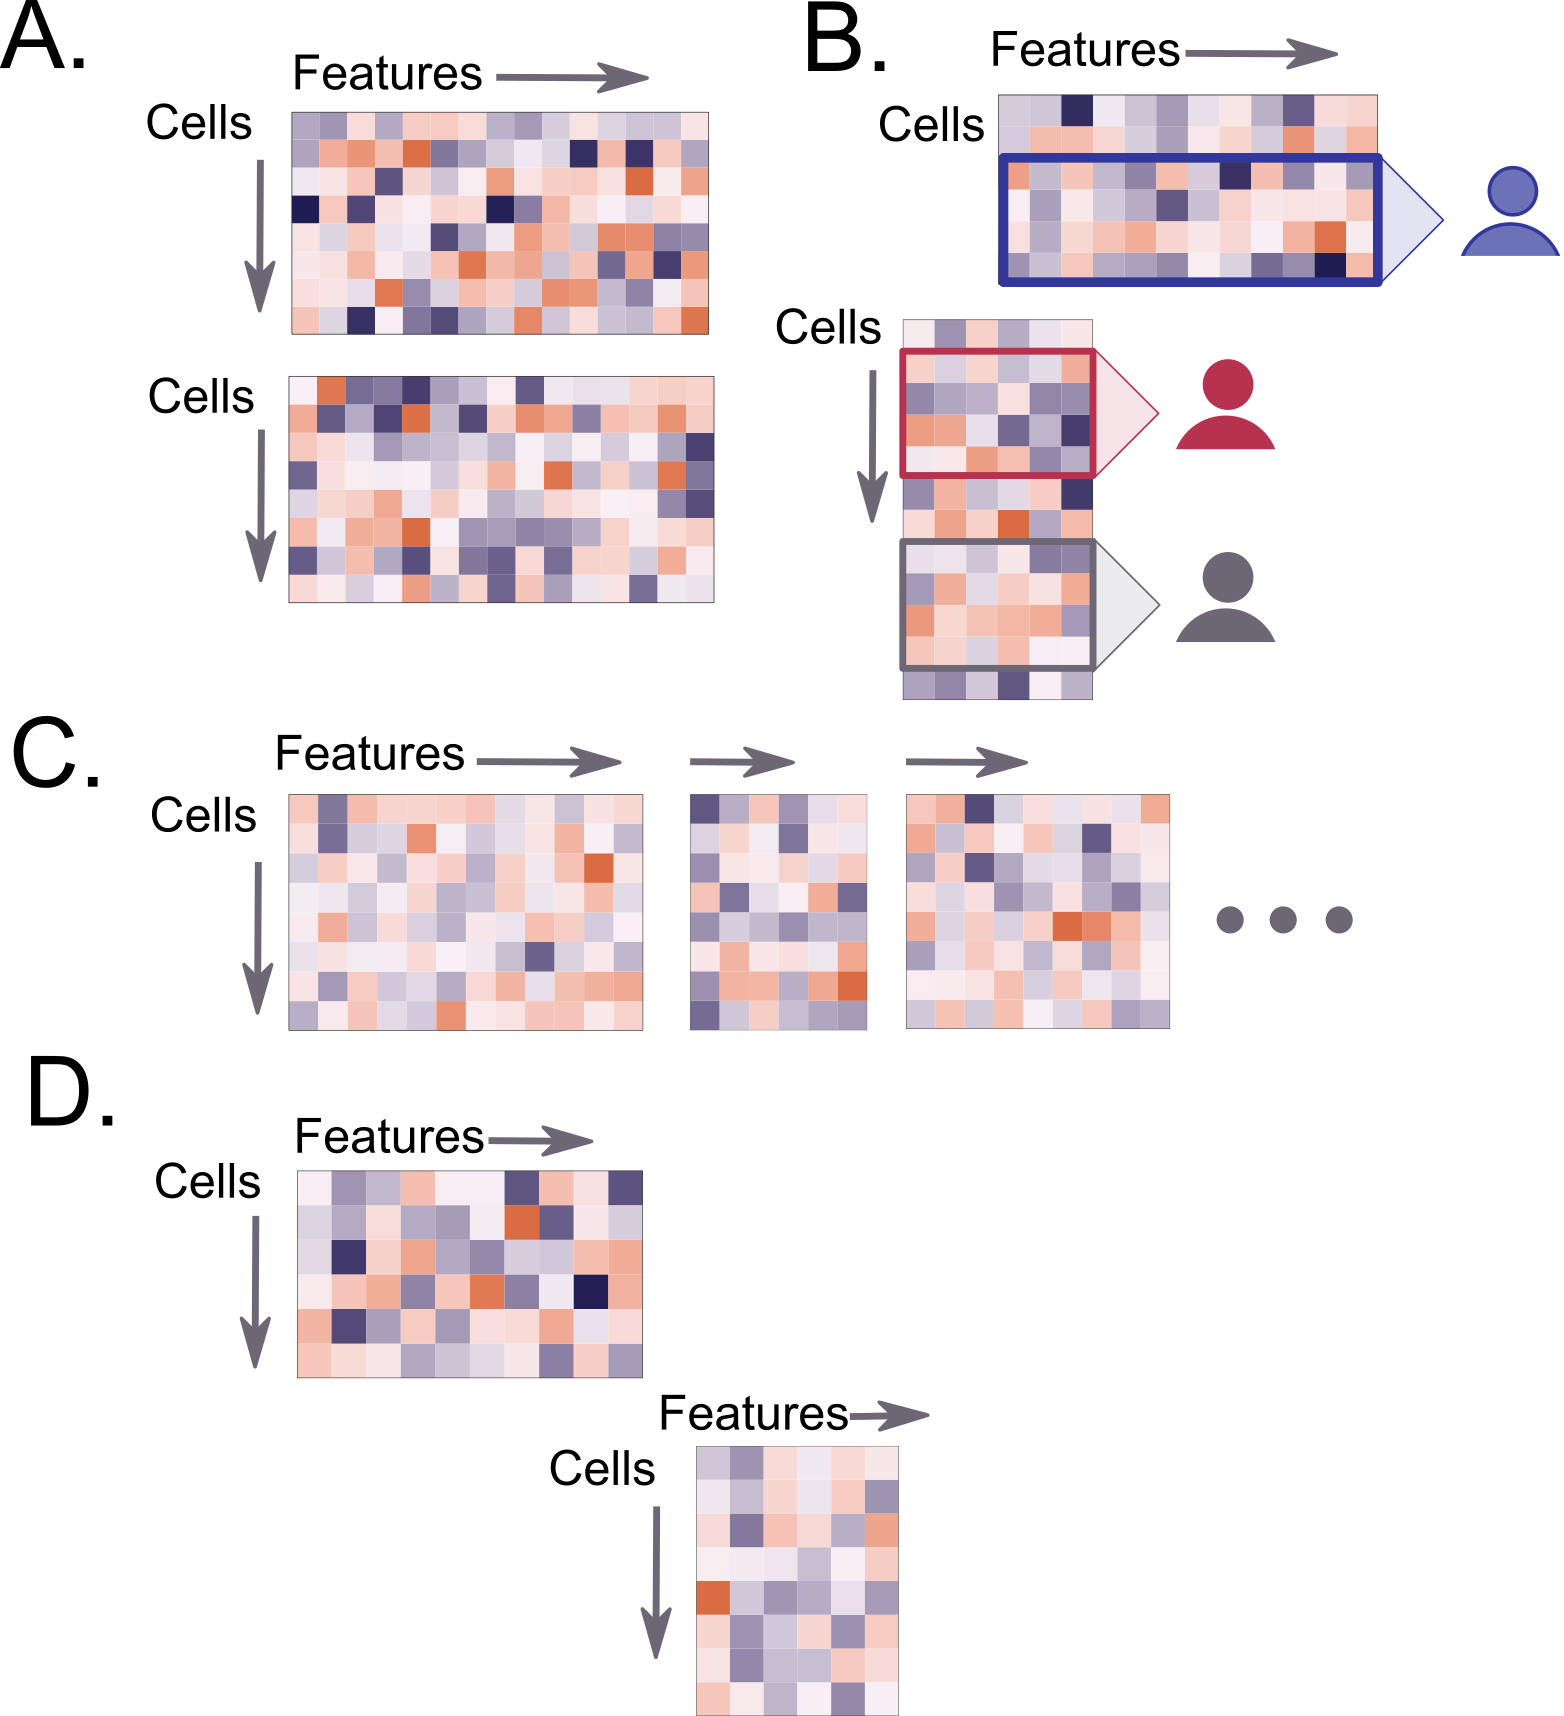
Caption figure: Common challenge 3: Addressing partial overlap of information across cells or featuresA. Overlap of features (genes) but not cells (e.g. spatial transcriptomics where cell type prediction for seqFISH data was performed based on scRNA-seq where cell types are known.
B. Partial overlap of features (proteins) but no overlap of cells (e.g. spatial proteomics that required data imputation or cell type prediction).
C. Overlap of cells across assays, but no overlap of features (e.g. scNMT-seq where data integration was performed).
D. Lack of overlap between cells and features (the so-called fourth corner problem in spatial proteomics hackathon).
Table: Different methods were used in the hackathon and further available as reproducible vignettes. * indicates that the method was not applied on the hackathon data. For some common challenges, ‘bulk’ indicates the method was originally developed for bulk omics, ‘sc’ indicates the method was specifically developed for single-cell data {#tbl:common}
Common challenges
Tasks
sc Spatial
sc targeted proteomics
sc NMT-seq
Pre-processing
Normalization & data transformation
Data distribution checks (Coullomb, Singh) High Variable Genes selection (Xu)
Imputation: Direct inversion with latent variables (Sankaran) Optimal transport to predict protein expression (Lin) K Nearest Neighbor averaging (Jeganathan)
No imputation: Biological Network Interaction (Foster*)
Hidden Markov random field Voronoi tesselation (Coullomb) (bulk)
Spatial autocorrelation with Moran’s Index (Hsu, Lin)
Selection of spatial discriminative features: Moran’s Index, NN correlation, Cell type, interaction composition, L function (Lin)
(all bulk?)
Inclusion of additional information
Survival prediction: Cox regression based on spatial features (Lin)
Include annotated hypersensitive sites index to anchor new/unseen data from DNase-seq, (sc)ATAC-seq, scNMT-seq, for de novo peak calling (Meuleman*) (bulk)
Challenges for interpretation
The analyses from each hackathon emphasized that regardless of the common difficulties faced by our participants, there is no one method fits all for multi-omics integration. An equally important complement to the diverse computational methods used to solve multi-omics analysis problems rests in the biological interpretation of their solutions, with the notable challenge that the integrated data from these approaches are often of higher dimension than the input datasets.
For example, low dimensional representation of the results may require additional contiguous data, such as spatial coordinates to capture higher level cellular structure or prognostics (two of our hackathons). Thus, efforts to interpret multi-omics data require standardized vocabulary, benchmarked methods, and abstracted latent variables that can be compared between studies.
Organizing patterns for interpretation
Interpretation hinges on the analysis method selected for a given dataset. Some methods used in the hackathons and summarized in Table 1 aimed to predict a clearly defined outcome, such as recognizing the environment of tumor cells versus that of healthy cells (see proteomics section). The supervised setting often provides easier interpretations, as one can easily rank the covariates and contiguous data in terms of their predictive potential.
However, when data are collected without the availability of a clear response (e.g. survival time, tumor size, cell growth) using multiple
different technologies, data integration requires organizing patterns that enable interpretation. Clustering is often used as one unsupervised method that can use latent variables - for example using a categorical variable such as cell type which was not directly measured on the data but enables simple interpretations [33]. Unfortunately, biological phenomenona are often not as clearcut.
During clustering, overseparating data by forcing the data into types only provides a static description when the variation should often be along a continuum. Indeed, although a latent factor can be a useful first approximation, the development of cells and their fate is a dynamic process. Thus, we recommend referring back to the original data that enabled interpretation of the cell trajectories: in our case, where the underlying latent variable of interest is expressed along a gradient of development (e.g. pseudo-time, disease progression).
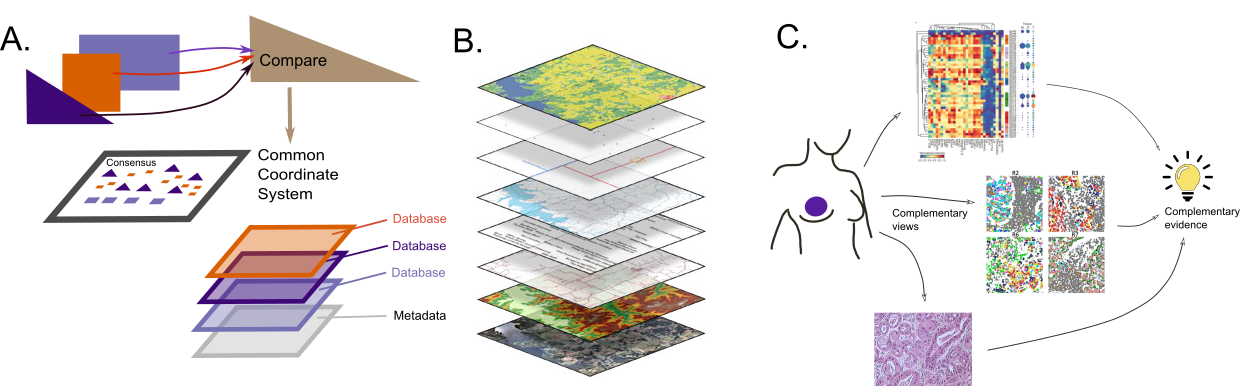
Nonetheless, latent variables represent a rich anchor for many multimodal methods and can often be useful in highlighting what the modalities have in “common” and how they differ, as shown in the scNMT-seq hackathon. Disparate sources of evidence, or in this case, data from different technologies, are more compelling than many replicates of the same technology. Thus, if different technologies allow a consensus on underlying latent variables, this information is worth retaining. The commonalities are well understood in the case of classical multivariate factor analyses where the data are decomposed into common and unique components [34]. A schematic summary of the different stages in interpretation is provided in Figure 5).
Figure 5:
Caption figure:
A Schematic diagram of stages of interpretation and integration of data sources.
B Standards in Geographic Information Systems enable the integration of multiple layers of data.
C Integrative analysis across multiple modes of data results in complementary evidence, allowing stronger conclusions, an instance of Cardinal Newman’s principle: ‘Supposes a thesis (e.g. the guilt of an accused man) is supported by a great deal of circumstantial evidence of different forms, but in agreement with each other; then even if each piece of evidence is in itself insufficient to produce any strong belief, the thesis is decisively strengthened by their joint effect.’
Reasoning by analogy with geospatial problems
Multiple domains of knowledge can be combined easily if there is a common coordinate system, as in geospatial analyses. This is often a goal in multimodal or conjoint analyses, when the first step is to find a common compromise or consensus on which to project each of the individual modalities.
Conjoint analyses also known as STATIS [35] was a very early multimodal method designed as “PCA of PCAs” where the first step in the analyses was to identify the commonalities between different modalities and define a consensus onto which the individual data sets were projected [36]. STATIS can be considered as an extension of the class of matrix decomposition methods to data cubes.
Many extensions to matrix decompositions have since been designed for multimodal data, [37] offers an overview of the relations between many of them.
In both spatial transcriptomics and the spatial proteomics hackathons, a spatial dimension was already naturally available, where we could leverage spatial statistics methods to quantify spatial effects. In these studies, contiguity and clustering can be tested and easily understood in the spatial context, and layers of information can be mapped to the natural coordinate system in the same way a GIS system incorporates them (Figure 5B).
The spatial coordinate system analogy can be pursued further by finding a “consensus space” that provides a common coordinate system. Thus, by creating an abstract coordinate space, we can leverage methods developed for true spatial co-occurrences, and evalute these co-occurrences in abstract spatial coordinates as an effective strategy for creating layered maps despite the the absence of a physical coordinate system. There are however pitfalls in using very sophisticated dimension reduction techniques which lead to over-interpretation or misinterpretation of spatial relations. One such example is the size and closeness of clusters in t-SNE which do not represent true densities or similarities in the original data.
Explaining results by linking databases
Figure 5A shows how connections to layers of information from external databases can be incorporated into the final output. Real biological understanding is often limited to the integration of this contiguous information that is available from metadata or from exterior sources such as Gene Ontologies, Biomart [38], Kegg, Human Cell Atlas (HCA) or within software systems (see software section).
As many methods suffer from identifiability issues, redundant biological knowledge can be enlightening. By providing information on the extreme points in a map or brushing a map with known gene expression features, one can delineate orientations and clusters. As an example, it is only through coloring by CD56 across time that we can see the dynamics of immune response [39], similar to the principle behind the interactive brushing illustrated in Figure 5C.
Explaining methods
Simulations can often provide effective and transparent communication tools to shed light into complex analytical methods. By generating data from different probabilistic models, we increase our understanding of the methods’ limitations including identifiability problems resulting from overparametrized models. More realistic data can also be simulated by adding constraints on the parameters that reduce or eliminate identifiability issues. By using well defined generative processes during data simulation, we can then benchmark methods to clarify what some complex methods do, as we discuss in the benchmarking section.
Visualization of step-by-step transformations and optimizations of data also help clarify how certain methods fit models or reduce data dimensionality. These visualizations are often very specialized (e.g. correspondence analyses, goodness of fit qqplots or rootograms, mean-variance fitting plots), but serve as intermediary checks to unpack seemingly black boxes analytical processes.
Finally, spanning all of these interpretation challenges is a central communication barriers between data analysts and the community of practitionners who do not have the same vocabulary or background. Many tools are used as black boxes where users do not have a clear understanding on the statistical or mathematical principles underpinning the methods. A clear glossary of terms, and how we are using those terms is crucial to improve communication. For example, many synonyms for multimodal data exist and some have nuances, as we have collated in Table 2. Understanding the relation between methods described by different teams is essential. Data scientist often try to organize the methods first, thus it is useful to create a dichotomy of methods and their underlying properties for our collaborators.
Techniques and challenges for benchmarking methods
Visualizations and biological assessment of marker gene lists
resulting from multi-omics analyses provide a critical interpretation of high-throughput data integration, but additional
quantitative metrics are necessary to delineate biologically-relevant
features from features arising from either computational or
technical artifacts. Quantitative benchmarks
are also essential to enable unbiased comparisons between analytical
methods. For example, the goal of multi-platform single-cell data
analysis is often the recovery of known cell types through
computational methods. Metrics such as the adjusted Rand Index
(ARI) enable a direct assessment of the clustering results with respect
to known cell types. When cell types or biological features are not
known a priori, benchmark methods can also be used to discover known
relationships between data modalities. For example, cis gene
regulatory mechanisms observed between chromatin accessibility and
gene expression. Our hackathons highlighted that many of these relationships are not fully understood
at the single-cell level, and that benchmarking standards are critically needed for validation (Figure 6A).
Figure 6:
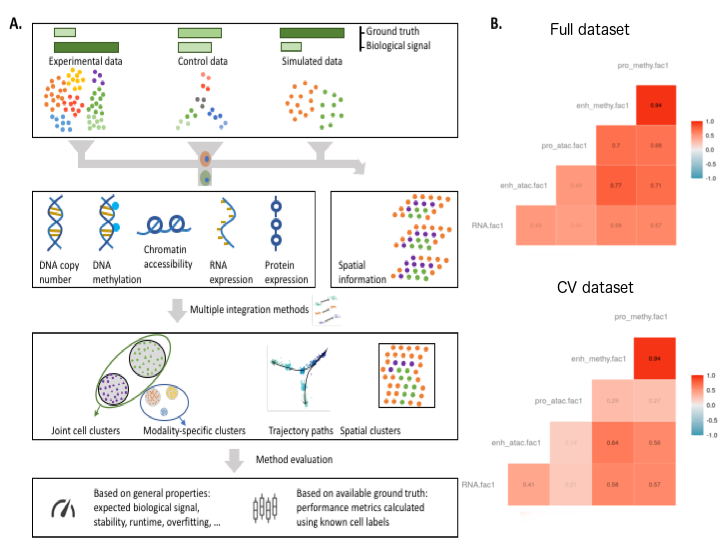
Caption figure: A Systematic benchmarking of single-cell multi-omic analysis
methods can involve experimental data (as per our hackathons),
custom control datasets, where known structure is imposed through the experimental design or simulated data. The amount of biological signal and ground truth available varies
considerably between these types of data. The resulting multi-omics datasets are analysed
by competing methods and compared using metrics that have general purpose or take ground truth into account (e.g. cell type labels or number of cell types simulated).
B scNMT-seq study: correlations with linear projections (MOFA+) evaluated with cross-validation.
Challenges and strategies for benchmarking
Benchmarking multi-modal methods is inherently difficult, as ground
truth is rarely known. Ground truth can be introduced through simulating
high-throughput data in silico, but in the context of data integration,
the simulation of a realistic covariance structure across features and
across data modalities are challenging
[40] and must rely on an underlying
generative model that may introduce further biases into the benchmarking
analysis. Another strategy is to use cross-validation within a study,
or conduct cross-study validation to assess whether solutions found by
multi-modal methods generalize to held-out observations or held-out
studies. The latter was attempted in the spatial proteomics
cross-study hackathon, but where ground truth was unknown.
Challenge 1: creating benchmarking datasets
Benchmark datasets serve two main purposes: to provide ground truth for the intended effect of exposure in a proposed study design, and to provide validation for an analytic task for which a new computational method may be proposed (e.g. data integration in our hackathons), Figure 6A.
For single-cell studies, benchmark datasets have largely focused on measuring sequencing depth and diversity of cell types derived from a single assay of interest (e.g. scRNA-seq). Common experimental designs involve creating artificial samples through the mixing of cells in known proportions [41,42,43] or creating dilution series to simulate variation in cell size [41,44]. Simulating data is also popular and made more convenient through software such as the splatter R package [45].
For multi-modal assays, while the intended effects can vary based on the leading biological questions, one may abstract out common data integration tasks such as co-embedding, mapping or correlation, and inferring causal relationships. We distinguish data integration from further downstream analyses that may occur on integrated samples such as differential analysis of both assays with regard to a certain exposure. Both the intended effects and data integration task rely on study design that takes into account the biological and technical variability via replicates, block design, randomization, the power analysis for the intended effect or data integration task, and the dependencies between modalities. For example, gene expression depends on gene regulatory element activity and thus requires that experiment design must also account for spatial and temporal elements in sampling for a given observation.
As such, no universal benchmark data scheme may suit every combination of modalities (e.g. mising cells design does not generalise to the spatial context), and benchmark datasets should be established for commonly used combinations of modalities or technologies towards specific data integration tasks.
Challenge 2: cross-validation within study
Cross-validation within a representative
multi-modal study is one possible approach for quantitative assessment
for unbiased comparison of methods. We note that the approach of
cross-validation – in which observations are split into folds or left
out individually for assessing model fit – has been used often for
parameter tuning within methods, or for other aspects of model selection
[24,40,46,47,48,49,50,51,52,53,54,55].
Similarly, permutation has been used to create null datasets, either
as a demonstration that a particular method is not overfitting, or for
parameter tuning, where the optimal parameter setting should result in
a model score that is far from the null distribution of model scores
[56,57,58].
Cross-validation is particularly useful as a quantitative assessment
of a method’s self-consistency, even though it cannot determine the
accuracy of a method in a completely unbiased way if we do not have
access to an external test data set for further confirmation.
As part of the third hackathon, a cross-validation analysis of the
scNMT-seq dataset using MOFA+ was performed. Strong relationships
found among pairs of modalities in training data were often reproduced
in held out cells (Figure 6B). This CV analysis also revealed
that we could reliably match dimensions of latent space across
cross-validation folds. Previous evaluations of multi-modal methods
have focused only on the top ‘latent factor’
[59], however, we showed in our analyses, many
latent factors can be reliably discovered in held out cells in studies
of complex biological processes such as the differentiation of
embryonic cells.
For clustering assessment, several studies have used resampling or
data-splitting strategies to determine prediction strength
[13,60,61,62]. These techniques could be further extended
in a multi-modal setting for clustering of cells into putative cell
types or cell states. Community-based benchmarking efforts in the
area of multi-modal data analysis could follow the paradigm of
the DREAM Challenges, with multi-modal
training data provided and test samples held out, in order to evaluate
the method submissions from participating groups.
Challenge 3: cross-validation between studies
Our benchmarking hackathons have emphasized the need to access
external studies for methods assessment and validation, where either
the ground truth is based on biological knowledge of the system being
studied, or via high-quality control experiments where the ground truth
(e.g. cell type labels) are known (Figure 6A).
To take advantage of all data and technologies available, cross-study
validation could also extend to cross-platform to assess whether
relationships discovered in one dataset are present in other datasets,
such as looking across single-cell and bulk omics, as was recently proposed in [63].
Software strategies to enable analyses of multimodal single-cell experiments
Open-source software is essential in bioinformatics and computational biology. Benchmark datasets, analysis pipelines, and the development of multimodal genome-scale experiments are all enabled through community-developed, open-source software, and data sharing platforms. A wide array of genomics frameworks for multi-platform single-cell data have been developed in R and Python. Along with other software, these frameworks use standardized licensing in Creative Commons, Artistic, or GNU so that all components are accessible for full vetting by the community (see List of sofware)). Our hackathons hinged on the central challenges such as widescale adoption, extension, and collaboration to enable inference and visualization of the multimodal single-cell experiments in our analytic frameworks. We designed each case study to leverage and build on these open frameworks to further develop and evaluate robust benchmarking strategies. Easy to use data packages to distribute the multi-omics data and reproducible vignettes were key outputs from our workshop.
Collaboration enabled through continuous integration
Open-source software efforts facilitate a community-level coordinated approach to support collaboration rather than duplication of effort between groups working on similar problems. Real-time improvements to the tool-set should be feasible, respecting the needs for stability, reliability, and continuity of access to evolving components. To that end, exploration and engagement with all these tools is richly enabled through code sharing resources. Our hackathons directly leveraged through GitHub with our reproducible analyses reports to enable continuous integration of changes to source codes (using Github Action), and containerized snapshots of the analyses environments. The hackathons analyses conducted in R were assembled into R packages to facilitate libraries loading, while those conducted in Python enabled automatic installation and deployment
Usability and adoption by the community
Robust software ecosystems are required to build broad user bases [64,65,66]. Bioconductor is one example of such ecosystem, that provides multiplatform and continuous delivery of contributed software while assisting a wide range of users with standardized documentation, tests, community forums, and workshops [67,68,69]. In the case of the hackathons, the R/Bioconductor ecosystem for multi-omics enabled data structures and vignettes to support reproducible, open-source, open development analysis. During this workshop, we identified key software goals needed to advance the methods and interpretation of multi-omics.
Challenge 1: data accessibility
Providing data to the scientific community is a long-standing issue. A particular challenge in our hackathons was that each data modality was characterized by a different collection of features from possibly non-overlapping collections of samples (see common challenges section). Thus, common data structures are needed to store and operate on these data collections, and support data dissemination with robust metadata and implementation of analytical frameworks.
The MultiAssayExperiment integrative data class from Bioconductor was our class of choice to enable the collation of standard data formats, easy data access, and processing. It uses the S4 object-oriented structure in R [70,71] and includes several features to support multi-platform genomics data analysis, to store features from multiple data modalities (e.g. gene expression units from scRNA-seq and protein units in sc-proteomics) from either the same or distinct cells, biological specimen of origin, or from multiple dimensions (e.g. spatial coordinates, locations of eQTLs). This class also enables to store sample metadata (e.g. study, center, phenotype, perturbation) and provides a map between the datasets from different assays for downstream analysis.
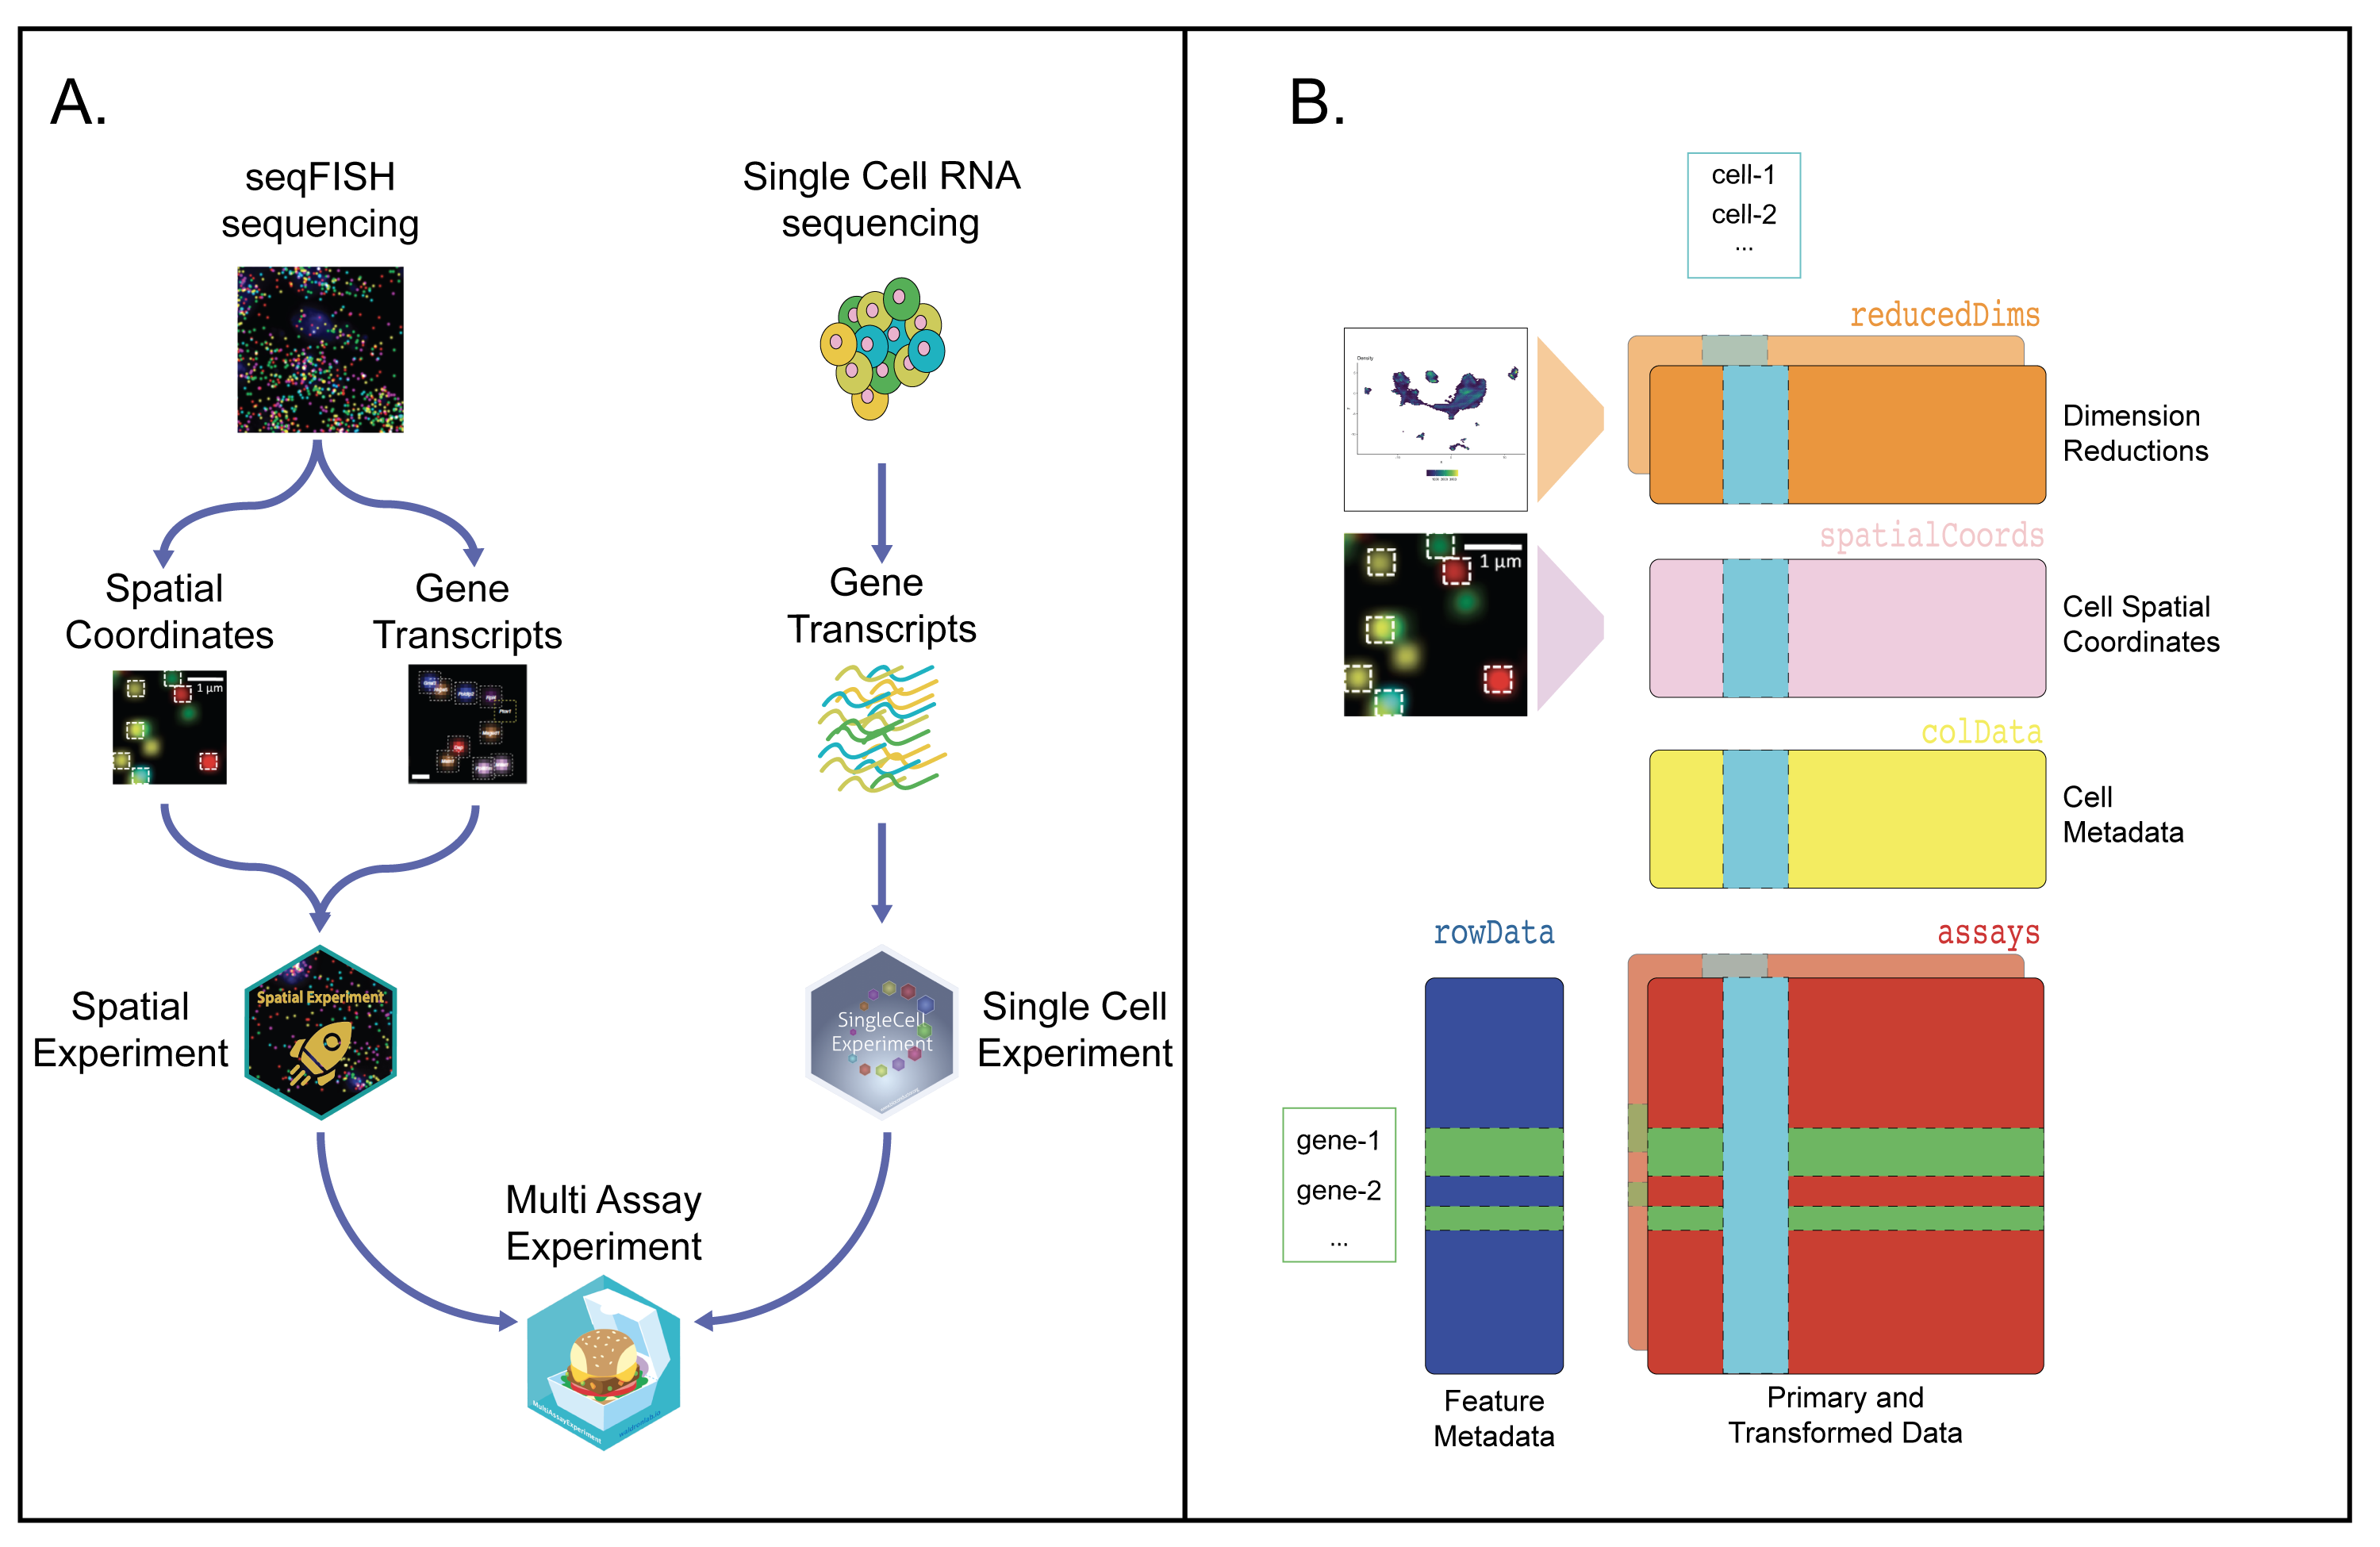
In our hackathons, pre-processing steps applied to the raw data were fully documented. The input data were stored as MultiAssayExperiment objects that were centrally managed and hosted on ExperimentHub[72] as a starting point for all analyses. The SingleCellMultiModal package was used to query the relevant datasets for each analysis [doi:10.18129/B9.bioc.SingleCellMultiModal] (Figure 7). Text-based machine-readable data were also made available for non-R users, and also to facilitate alternative data preprocessing for participants.
Besides efficient data storage, several hackathon contributors used the MultiAssayExperiment class to implement further data processing and extraction of spatial information from raster objects in their analyses. This infrastructure was readily suitable for the spatial and scNMT-seq hackathons but the lack of overlap between samples in the spatial proteomics hackathon revealed an important area of future work to link biologically related datasets without direct feature or sample mappings for multi-omics analysis. Further, our hackathons highlighted the need for scalability of storing and efficiently retrieving single-cell data datasets [73,74]. New algorithms are emerging, that allow for data to be stored in memory or on disk (e.g. [75,76] in R or [77] in Python).
Figure 7:
Caption figure: A Software infrastructure using Bioconductor for the first hackathon to combine seqFISH-based SpatialExperiment and SingleCellExperiment instances into a MultiAssayExperiment. B To combine these two different experiments, the seqFISH data were stored into a SpatialExperiment S4 class object, while the scRNA-seq data were stored into a SingleCellExperiment class object [78]. These objects were then stored into a MultiAssayExperiment class object and released with the SingleCellMultiModal Bioconductor package [79].
Challenge 2: software infrastructure to handle assay-specific features
The hackathons further highlighted emerging challenges to handle different data modalities.
RNA-seq has well-defined units and IDs (e.g., transcript names), but other assays need to be summarized at different genomic scales (e.g., gene promoters, exons, introns, or gene bodies), as was highlighted in the scNMT-seq hackathon. Tools such as the GenomicRanges R package [80] have been proposed to compute summaries at different scales and overlaps between signal (e.g., ATAC-seq peaks) and genomic annotation.
Further, the observations of different modalities may not be directly comparable: for instance, gene expression may be measured from individual cells in single-cell RNA-seq, but spatial transcriptomics may have a finer (sub-cellular) or coarser (multi-cellular) resolution. Methods such as SPOTlight [81] can be used to deconvolute multi-cellular spots signal.
Finally, in the absence of universal standards, the metadata available may vary from modalities, or independent studies (e.g. spatial proteomics), thus urging the need from the computational biology community to define the minimum set of metadata variables necessary for each assay, as well as for pairs of assays to be comparable for common analyses.
Challenge 3: accessible vizualization
Our brainstorm discussions on the Data Interpretation Challenge highlighted the importance of novel data visualization strategies to make sens of multi-modal data analyses. Often, these visualization strategies rely on heatmaps or reduced dimension plots, and utilize color to represent the different dimensions. These colors and low dimensional plots facilitate pattern detection and interpretation of increasingly complex and rich data. However, relying on color for interpretation leads to difficulties in perceiving patterns for a substantial proportion of the population with color vision deficiencies and can result in different data interpretations between individuals.
Presenting accessible scientific information requires the inclusion of colorblind friendly visualizations [82,83] standardized as default settings through use of color palettes such as R/viridis [84] and dittoSeq [85] with a limit of 10 colors. Additional visual cues to differentiate regions or cells can also reduce the dependence on colors using hatched areas or point shapes. The inclusion an “accessibility caption” accompanying figures which to guide the reader’s perception of the images would also greatly benefit broader data accessibility. Thus, implementing community standards for accessible visualizations is essential for bioinformatics software communities to ensure standardized interpretation of multi-platform single-cell data.
Discussion
The Mathematical Frameworks for Integrative Analysis of Emerging Biological Data Workshop demonstrated the power of hackathons to both inform and develop new analysis methods to capture the complex, multi-scale nature of biological datasets from high-throughput data modalities. Notably, the hackathon studies of the workshop were specifically designed to span state-of-the-art multi-omics challenges to map the epigenetic, molecular, and cellular interaction across time and sample populations. Single-cell measurements spanning molecular modalities can inherently simplify the challenge of linking disparate biological scales, but layering new sets of molecular measurements increases the complexity of the analyses to interpret these data. The computational needs hinge on the underlying biological question being asked as well as the characteristics of the data themselves. In our workshop, different modelling considerations had to be made for multi-modal integration, as higlighted in the seqFISH and scNMT-seq challenges (matching on the same genes, or cells) and the scProteomics challenge (partially unmatched measurements). Regardless, through these hackathons we identified several common analysis themes spanning algorithmic advances, interpretation, benchmarking, and software infrastructure necessary for biological interpretation. All hackathons required methods for dealing with data quality, data loss from summarization, timing variances between and within omics layers, and batch effects. These represent the necessary challenges to overcome in the coming years, along with efficient and insightful data visualization strategies to infer regulatory relationships between different omics.
Technologies to profile biological systems at single-cell resolution and across molecular scales are advancing at an unprecedented pace. Analytically, these advances require the computational community to pursue research that can first enable robust analyses tailored to a specific biology or measurement technology, and second, that can scale and adapt to these rapid advances. Our hackathons highlighted current technologies for spatial molecular profiling. The two technologies used in this study both have limited molecular resolution. Therefore, multi-platform data combining the spatial molecular data from either seqFISH, MIBI, or imaging mass cytometry require complementary data from other single-cell technologies to provide both high spatial and molecular resolution enabled through data integration. We note that additional technologies, such as slide-seq [86] and Visium from 10X Genomics produce spatially resolved molecular measurements approaching measurements of the whole transcriptome, but lack the fine spatial resolution of these alternative imaging technologies. As such, emerging technologies still require further multi-platform data integration for comprehensive analysis.
The scNMT-seq challenge did not include spatially resolved data but highlighted the potential of further inference of gene regulation through concurrent profiling of RNA, methylation, and chromatin state. Technological advances for multi-omics spatial data and epigenetics data are rapidly advancing and becoming increasingly available through Nanostring, 10X Genomics, Akoya Biosciences, and others. Our workshop keynote Bernd Bodenmiller presented new research-level technological advances that enable three-dimensional spatial molecular profiling [87]. Other technologies are currently expanding to allow for temporally resolved profiling [88]. Integration strategies aware of these future directions and the mathematical challenges that span technologies will be most adept at advancing biological knowledge: this was the primary aim of this workshop.
The implementation of novel analysis tools requires further robust software ecosystems, including Bioconductor [89], Biopython, and toolkits such as Scanpy [77], Seurat [90], or Giotto [10], in which users can create their analysis approaches and while anticipating stable and adaptive data structures robust for these emerging technologies. The size of these emerging datasets, particularly in the context of their application to atlas projects (e.g. the Human Tumor Atlas Network [91], Human Cell Atlas [92], Allen Brain Initiative, Brain Initiative Cell Census Network, or ENCODE, to cite a few) are key examples that computational efficiency and scalability of these implementations are becoming ever more critical.
In addition to new technologies, we wish to emphasize that arising multi-omics analysis methods can support the generation of new data sources to resolve the multi-scale nature of biological systems. For example, while the workshop posed the scNMT-seq data and spatial molecular datasets as distinct challenges for data integration, integration of matched datasets between these spatial and epigenetic profiling techniques could further resolve the dependence of cell-type and cellular-interactions of regulatory networks. By embedding prior biological knowledge as rules in the analysis approaches, additional sources of data can generate a new representation of a biological system. For example, curated regulatory networks from databases such as KEGG, Biocarta, GO, TRANSFAC, or MSigDB
provide commonly used frameworks for this prior knowledge. These gene regulatory networks must be extended to map the impact of cellular context on transcriptional regulation that are being uncovered by emerging single-cell atlases. The regulatory networks and dynamic features captured in single-cell data also provide the potential for future techniques to predict molecular and cellular states. Our hackathons and workshop have shown that merging single-cell data with mathematical models have the potential to predict behaviors in biological systems using rules derived from only prior biological knowledge.
List of Figures, Tables and online resources
Figures
Figure 1: spatial transcriptomics hackathon
Figure 2: spatial proteomics single cell hackathon
Figure 3: scNMT-seq hackathon
Figure 5: Common challenges across hackathons
Figure 6: Interpretation challenges
Figure 6: Benchmarking strategies
Figure 7: Software infrastructure for multi modal single cell
Tables
Table 1 (main): Summary of tasks and methods across all hackathons highlighting methods and common challenges
Table 4 (main): Reproducible vignettes for analysis
Table 2 (main): Glossary of terms
Table 3 (supp): List of single cell analysis software
Online resources (optional as referred above)
Online resource 1: Three hackathon datasets (github)
Online resource 2: R packages with open source reproducible vignettes (12 vignettes)
List of software for multi modal single cell analysis.
Element of interest in a network and linked to other nodes. For example: people, cells, proteins or genes. Nodes can have several properties called attributes like cell type or position.
The relationship between 2 nodes in a network. For example: friendship in social networks, cells in contact in a spatial network, or gene-gene interactions in a gene regulatory network.
A measurable quantity that describes an observation’s attributes. Variables from different modalities include age, sex, gene or protein abundance, single nucleotide variants, operational taxonomic units, pixel intensity etc.
A variable that is associated with normal or disease processes, or responses to exposures, or interventions. Any change in this variable is also associated with a change in the associated clinical outcome. These variables may be used for diagnostic, monitoring, Pharmacodynamic responses. Examples include LDL cholesterol, CD4 counts, hemoglobin A1C.
A subset of the originally measured variables that are determined to be associated with the outcome or response variable. This may be determined using statistical inference, feature selection methods, or machine/statistical learning.
A single entity belonging to a larger grouping. Examples include patients, subjects, participants, cells, biological sample, usually the unit of observation on which the variables are measured etc.
2. Adult mouse cortical cell taxonomy revealed by single cell transcriptomics
Bosiljka Tasic, Vilas Menon, Thuc Nghi Nguyen, Tae Kyung Kim, Tim Jarsky, Zizhen Yao, Boaz Levi, Lucas T Gray, Staci A Sorensen, Tim Dolbeare, … Hongkui Zeng Nature Neuroscience (2016-01-04) https://doi.org/f778w5
DOI: 10.1038/nn.4216 · PMID: 26727548 · PMCID: PMC4985242
3. Identification of spatially associated subpopulations by combining scRNAseq and sequential fluorescence in situ hybridization data
Qian Zhu, Sheel Shah, Ruben Dries, Long Cai, Guo-Cheng Yuan Nature Biotechnology (2018-10-29) https://doi.org/gfgn8x
DOI: 10.1038/nbt.4260 · PMID: 30371680 · PMCID: PMC6488461
4. A Single-Cell Atlas of the Tumor and Immune Ecosystem of Human Breast Cancer
Johanna Wagner, Maria Anna Rapsomaniki, Stéphane Chevrier, Tobias Anzeneder, Claus Langwieder, August Dykgers, Martin Rees, Annette Ramaswamy, Simone Muenst, Savas Deniz Soysal, … Bernd Bodenmiller Cell (2019-05) https://doi.org/gfzbz7
DOI: 10.1016/j.cell.2019.03.005 · PMID: 30982598 · PMCID: PMC6526772
5. A Structured Tumor-Immune Microenvironment in Triple Negative Breast Cancer Revealed by Multiplexed Ion Beam Imaging
Leeat Keren, Marc Bosse, Diana Marquez, Roshan Angoshtari, Samir Jain, Sushama Varma, Soo-Ryum Yang, Allison Kurian, David Van Valen, Robert West, … Michael Angelo Cell (2018-09) https://doi.org/gd4wms
DOI: 10.1016/j.cell.2018.08.039 · PMID: 30193111 · PMCID: PMC6132072
6. Epigenetic regulation in development: is the mouse a good model for the human?
Courtney W Hanna, Hannah Demond, Gavin Kelsey Human Reproduction Update (2018-09) https://doi.org/gd3d4z
DOI: 10.1093/humupd/dmy021 · PMID: 29992283 · PMCID: PMC6093373
7. Single-cell in situ RNA profiling by sequential hybridization
Eric Lubeck, Ahmet F Coskun, Timur Zhiyentayev, Mubhij Ahmad, Long Cai Nature Methods (2014-03-28) https://doi.org/ggrr5b
DOI: 10.1038/nmeth.2892 · PMID: 24681720 · PMCID: PMC4085791
9. Transcriptome-scale super-resolved imaging in tissues by RNA seqFISH+
Chee-Huat Linus Eng, Michael Lawson, Qian Zhu, Ruben Dries, Noushin Koulena, Yodai Takei, Jina Yun, Christopher Cronin, Christoph Karp, Guo-Cheng Yuan, Long Cai Nature (2019-03-25) https://doi.org/gfxgqx
DOI: 10.1038/s41586-019-1049-y · PMID: 30911168 · PMCID: PMC6544023
10. Giotto, a toolbox for integrative analysis and visualization of spatial expression data
Ruben Dries, Qian Zhu, Rui Dong, Chee-Huat Linus Eng, Huipeng Li, Kan Liu, Yuntian Fu, Tianxiao Zhao, Arpan Sarkar, Feng Bao, … Guo-Cheng Yuan bioRxiv (2020-05-30) https://doi.org/gg84qf
DOI: 10.1101/701680
11. Spatial reconstruction of single-cell gene expression data
Rahul Satija, Jeffrey A Farrell, David Gennert, Alexander F Schier, Aviv Regev Nature Biotechnology (2015-04-13) https://doi.org/f7bmck
DOI: 10.1038/nbt.3192 · PMID: 25867923 · PMCID: PMC4430369
12. Single-Cell Multi-omic Integration Compares and Contrasts Features of Brain Cell Identity
Joshua D. Welch, Velina Kozareva, Ashley Ferreira, Charles Vanderburg, Carly Martin, Evan Z. Macosko Cell (2019-06) https://doi.org/gf3m3v
DOI: 10.1016/j.cell.2019.05.006 · PMID: 31178122 · PMCID: PMC6716797
13. Cluster Validation by Prediction Strength
Robert Tibshirani, Guenther Walther Journal of Computational and Graphical Statistics (2005-09) https://doi.org/fvtcf4
DOI: 10.1198/106186005x59243
14. Optimal-Transport Analysis of Single-Cell Gene Expression Identifies Developmental Trajectories in Reprogramming
Geoffrey Schiebinger, Jian Shu, Marcin Tabaka, Brian Cleary, Vidya Subramanian, Aryeh Solomon, Joshua Gould, Siyan Liu, Stacie Lin, Peter Berube, … Eric S. Lander Cell (2019-03) https://doi.org/gfwk5n
DOI: 10.1016/j.cell.2019.02.026 · PMID: 30849376 · PMCID: PMC6615720
16. Spatial proteomics: a powerful discovery tool for cell biology
Emma Lundberg, Georg H. H. Borner Nature Reviews Molecular Cell Biology (2019-01-18) https://doi.org/gft39v
DOI: 10.1038/s41580-018-0094-y · PMID: 30659282
17. Matching species traits to environmental variables: a new three-table ordination method
S. Dolédec, D. Chessel, C. J. F. ter Braak, S. Champely Environmental and Ecological Statistics (1996-06) https://doi.org/fhwz55
DOI: 10.1007/bf02427859
18. Using single‐cell genomics to understand developmental processes and cell fate decisions
Jonathan A Griffiths, Antonio Scialdone, John C Marioni Molecular Systems Biology (2018-04-16) https://doi.org/gdgbtq
DOI: 10.15252/msb.20178046 · PMID: 29661792 · PMCID: PMC5900446
20. scNMT-seq enables joint profiling of chromatin accessibility DNA methylation and transcription in single cells
Stephen J. Clark, Ricard Argelaguet, Chantriolnt-Andreas Kapourani, Thomas M. Stubbs, Heather J. Lee, Celia Alda-Catalinas, Felix Krueger, Guido Sanguinetti, Gavin Kelsey, John C. Marioni, … Wolf Reik Nature Communications (2018-02-22) https://doi.org/gc4q72
DOI: 10.1038/s41467-018-03149-4 · PMID: 29472610 · PMCID: PMC5823944
21. Multi-omics profiling of mouse gastrulation at single-cell resolution
Ricard Argelaguet, Stephen J. Clark, Hisham Mohammed, L. Carine Stapel, Christel Krueger, Chantriolnt-Andreas Kapourani, Ivan Imaz-Rosshandler, Tim Lohoff, Yunlong Xiang, Courtney W. Hanna, … Wolf Reik Nature (2019-12-11) https://doi.org/ggfrnn
DOI: 10.1038/s41586-019-1825-8 · PMID: 31827285 · PMCID: PMC6924995
22. Pan-cancer identification of clinically relevant genomic subtypes using outcome-weighted integrative clustering
Arshi Arora, Adam B. Olshen, Venkatraman E. Seshan, Ronglai Shen bioRxiv (2020-05-12) https://doi.org/gg8np9
DOI: 10.1101/2020.05.11.084798
23. Variable selection for generalized canonical correlation analysis
A. Tenenhaus, C. Philippe, V. Guillemot, K.-A. Le Cao, J. Grill, V. Frouin Biostatistics (2014-02-17) https://doi.org/gg583d
DOI: 10.1093/biostatistics/kxu001 · PMID: 24550197
24. mixOmics: An R package for ‘omics feature selection and multiple data integration
Florian Rohart, Benoît Gautier, Amrit Singh, Kim-Anh Lê Cao PLOS Computational Biology (2017-11-03) https://doi.org/gcj84s
DOI: 10.1371/journal.pcbi.1005752 · PMID: 29099853 · PMCID: PMC5687754
26. MOFA+: a statistical framework for comprehensive integration of multi-modal single-cell data
Ricard Argelaguet, Damien Arnol, Danila Bredikhin, Yonatan Deloro, Britta Velten, John C. Marioni, Oliver Stegle Genome Biology (2020-05-11) https://doi.org/ggvwsr
DOI: https://doi.org/10.1186/s13059-020-02015-1
28. Eleven grand challenges in single-cell data science
David Lähnemann, Johannes Köster, Ewa Szczurek, Davis J. McCarthy, Stephanie C. Hicks, Mark D. Robinson, Catalina A. Vallejos, Kieran R. Campbell, Niko Beerenwinkel, Ahmed Mahfouz, … Alexander Schönhuth Genome Biology (2020-02-07) https://doi.org/ggkkr4
DOI: 10.1186/s13059-020-1926-6 · PMID: 32033589 · PMCID: PMC7007675
29. Variance stabilization applied to microarray data calibration and to the quantification of differential expression
W. Huber, A. von Heydebreck, H. Sultmann, A. Poustka, M. Vingron Bioinformatics (2002-07-01) https://doi.org/dbb6xx
DOI: 10.1093/bioinformatics/18.suppl_1.s96 · PMID: 12169536
30. Integrative inference of brain cell similarities and differences from single-cell genomics
Joshua Welch, Velina Kozareva, Ashley Ferreira, Charles Vanderburg, Carly Martin, Evan Macosko bioRxiv (2018-11-02) https://doi.org/gfgr7b
DOI: 10.1101/459891
32. Combining the fourth-corner and the RLQ methods for assessing trait responses to environmental variation
Stéphane Dray, Philippe Choler, Sylvain Dolédec, Pedro R. Peres-Neto, Wilfried Thuiller, Sandrine Pavoine, Cajo J. F. ter Braak Ecology (2014-01) https://doi.org/gdsf9z
DOI: 10.1890/13-0196.1 · PMID: 24649641
38. Mapping identifiers for the integration of genomic datasets with the R/Bioconductor package biomaRt
Steffen Durinck, Paul T Spellman, Ewan Birney, Wolfgang Huber Nature Protocols (2009-07-23) https://doi.org/c4b7dd
DOI: 10.1038/nprot.2009.97 · PMID: 19617889 · PMCID: PMC3159387
39. Characterization of the Impact of Daclizumab Beta on Circulating Natural Killer Cells by Mass Cytometry
Thanmayi Ranganath, Laura J. Simpson, Anne-Maud Ferreira, Christof Seiler, Elena Vendrame, Nancy Zhao, Jason D. Fontenot, Susan Holmes, Catherine A. Blish Frontiers in Immunology (2020-04-24) https://doi.org/gg5jcr
DOI: 10.3389/fimmu.2020.00714 · PMID: 32391016 · PMCID: PMC7194113
40. DIABLO: an integrative approach for identifying key molecular drivers from multi-omics assays
Amrit Singh, Casey P Shannon, Benoît Gautier, Florian Rohart, Michaël Vacher, Scott J Tebbutt, Kim-Anh Lê Cao Bioinformatics (2019-09-01) https://doi.org/ggpt9c
DOI: 10.1093/bioinformatics/bty1054 · PMID: 30657866 · PMCID: PMC6735831
41. Benchmarking single cell RNA-sequencing analysis pipelines using mixture control experiments
Luyi Tian, Xueyi Dong, Saskia Freytag, Kim-Anh Lê Cao, Shian Su, Abolfazl JalalAbadi, Daniela Amann-Zalcenstein, Tom S. Weber, Azadeh Seidi, Jafar S. Jabbari, … Matthew E. Ritchie Nature Methods (2019-05-27) https://doi.org/gf3jhp
DOI: 10.1038/s41592-019-0425-8 · PMID: 31133762
42. Benchmarking single-cell RNA-sequencing protocols for cell atlas projects
Elisabetta Mereu, Atefeh Lafzi, Catia Moutinho, Christoph Ziegenhain, Davis J. McCarthy, Adrián Álvarez-Varela, Eduard Batlle, Sagar, Dominic Grün, Julia K. Lau, … Holger Heyn Nature Biotechnology (2020-04-06) https://doi.org/ggrbbh
DOI: 10.1038/s41587-020-0469-4 · PMID: 32518403
43. Systematic comparison of single-cell and single-nucleus RNA-sequencing methods
Jiarui Ding, Xian Adiconis, Sean K. Simmons, Monika S. Kowalczyk, Cynthia C. Hession, Nemanja D. Marjanovic, Travis K. Hughes, Marc H. Wadsworth, Tyler Burks, Lan T. Nguyen, … Joshua Z. Levin Nature Biotechnology (2020-04-06) https://doi.org/ggrksw
DOI: 10.1038/s41587-020-0465-8 · PMID: 32341560 · PMCID: PMC7289686
44. Accounting for technical noise in single-cell RNA-seq experiments
Philip Brennecke, Simon Anders, Jong Kyoung Kim, Aleksandra A Kołodziejczyk, Xiuwei Zhang, Valentina Proserpio, Bianka Baying, Vladimir Benes, Sarah A Teichmann, John C Marioni, Marcus G Heisler Nature Methods (2013-09-22) https://doi.org/gbd3mc
DOI: 10.1038/nmeth.2645 · PMID: 24056876
46. A Sparse PLS for Variable Selection when Integrating Omics Data
Kim-Anh Lê Cao, Debra Rossouw, Christèle Robert-Granié, Philippe Besse Statistical Applications in Genetics and Molecular Biology (2008-01-18) https://doi.org/cw7zft
DOI: 10.2202/1544-6115.1390 · PMID: 19049491
47. Sparse principal component analysis via regularized low rank matrix approximation
Haipeng Shen, Jianhua Z. Huang Journal of Multivariate Analysis (2008-07) https://doi.org/b7x3cc
DOI: 10.1016/j.jmva.2007.06.007
48. Quantifying the Association between Gene Expressions and DNA-Markers by Penalized Canonical Correlation Analysis
Sandra Waaijenborg, Philip C. Verselewel de Witt Hamer, Aeilko H Zwinderman Statistical Applications in Genetics and Molecular Biology (2008-01-23) https://doi.org/bpzb68
DOI: 10.2202/1544-6115.1329 · PMID: 18241193
49. CCA : An R Package to Extend Canonical Correlation Analysis
Ignacio Gonzalez, Sébastien Déjean, Pascal Martin, Alain Baccini Journal of Statistical Software (2008) https://doi.org/gf4f5m
DOI: 10.18637/jss.v023.i12
50. HIGHLIGHTING RELATIONSHIPS BETWEEN HETEROGENEOUS BIOLOGICAL DATA THROUGH GRAPHICAL DISPLAYS BASED ON REGULARIZED CANONICAL CORRELATION ANALYSIS
I. GONZÁLEZ, S. DÉJEAN, P. G. P. MARTIN, O. GONÇALVES, P. BESSE, A. BACCINI Journal of Biological Systems (2011-11-21) https://doi.org/bmbjf5
DOI: 10.1142/s0218339009002831
51. A penalized matrix decomposition, with applications to sparse principal components and canonical correlation analysis
D. M. Witten, R. Tibshirani, T. Hastie Biostatistics (2009-04-17) https://doi.org/fd4g54
DOI: 10.1093/biostatistics/kxp008 · PMID: 19377034 · PMCID: PMC2697346
52. Sparse Canonical Correlation Analysis with Application to Genomic Data Integration
Elena Parkhomenko, David Tritchler, Joseph Beyene Statistical Applications in Genetics and Molecular Biology (2009-01-06) https://doi.org/b7x4jb
DOI: 10.2202/1544-6115.1406 · PMID: 19222376
53. Integrative analysis of gene expression and copy number alterations using canonical correlation analysis
Charlotte Soneson, Henrik Lilljebjörn, Thoas Fioretos, Magnus Fontes BMC Bioinformatics (2010-04-15) https://doi.org/dtxhsx
DOI: 10.1186/1471-2105-11-191 · PMID: 20398334 · PMCID: PMC2873536
54. Gene expression signatures modulated by epidermal growth factor receptor activation and their relationship to cetuximab resistance in head and neck squamous cell carcinoma
Elana J Fertig, Qing Ren, Haixia Cheng, Hiromitsu Hatakeyama, Adam P Dicker, Ulrich Rodeck, Michael Considine, Michael F Ochs, Christine H Chung BMC Genomics (2012) https://doi.org/gb3fgp
DOI: 10.1186/1471-2164-13-160 · PMID: 22549044 · PMCID: PMC3460736
56. Cross-platform comparison and visualisation of gene expression data using co-inertia analysis
Aedín C. Culhane, Guy Perrière, Desmond G. Higgins BMC bioinformatics (2003-11-21)
DOI: 10.1186/1471-2105-4-59 · PMCID: PMC317282
57. Extensions of Sparse Canonical Correlation Analysis with Applications to Genomic Data
Daniela M Witten, Robert J. Tibshirani Statistical Applications in Genetics and Molecular Biology (2009-01-09) https://doi.org/b45jtg
DOI: 10.2202/1544-6115.1470 · PMID: 19572827 · PMCID: PMC2861323
58. MOGSA: Integrative Single Sample Gene-set Analysis of Multiple Omics Data
Chen Meng, Azfar Basunia, Bjoern Peters, Amin Moghaddas Gholami, Bernhard Kuster, Aedín C. Culhane Molecular & Cellular Proteomics (2019-08-09) https://doi.org/ggf3j3
DOI: 10.1074/mcp.tir118.001251 · PMID: 31243065 · PMCID: PMC6692785
59. Consistency and overfitting of multi-omics methods on experimental data
Sean D McCabe, Dan-Yu Lin, Michael I Love Briefings in Bioinformatics (2020-07) https://doi.org/gghpmf
DOI: 10.1093/bib/bbz070 · PMID: 31281919 · PMCID: PMC7373174
60. Bootstrapping cluster analysis: Assessing the reliability of conclusions from microarray experiments
M. K. Kerr, G. A. Churchill Proceedings of the National Academy of Sciences (2001-07-24) https://doi.org/cgpp6p
DOI: 10.1073/pnas.161273698 · PMID: 11470909 · PMCID: PMC55356
61. A prediction-based resampling method for estimating the number of clusters in a dataset
Sandrine Dudoit, Jane Fridlyand Genome Biology (2002-06-25)
DOI: 10.1186/gb-2002-3-7-research0036 · PMCID: PMC126241
62. A Three-Gene Model to Robustly Identify Breast Cancer Molecular Subtypes
Benjamin Haibe-Kains, Christine Desmedt, Sherene Loi, Aedin C. Culhane, Gianluca Bontempi, John Quackenbush, Christos Sotiriou JNCI: Journal of the National Cancer Institute (2012-02-22) https://doi.org/fzb27r
DOI: 10.1093/jnci/djr545 · PMID: 22262870 · PMCID: PMC3283537
63. A simple, scalable approach to building a cross-platform transcriptome atlas
Paul W Angel, Nadia Rajab, Yidi Deng, Chris M Pacheco, Tyrone Chen, Kim-Anh Lê Cao, Jarny Choi, Christine A Wells bioRxiv (2020-03-11) https://doi.org/gg898g
DOI: 10.1101/2020.03.09.984468
71. Software for the Integration of Multiomics Experiments in Bioconductor
Marcel Ramos, Lucas Schiffer, Angela Re, Rimsha Azhar, Azfar Basunia, Carmen Rodriguez, Tiffany Chan, Phil Chapman, Sean R. Davis, David Gomez-Cabrero, … Levi Waldron Cancer Research (2017-10-31) https://doi.org/gcj278
DOI: 10.1158/0008-5472.can-17-0344 · PMID: 29092936 · PMCID: PMC5679241
75. mbkmeans: fast clustering for single cell data using mini-batch k -means
Stephanie C. Hicks, Ruoxi Liu, Yuwei Ni, Elizabeth Purdom, Davide Risso bioRxiv (2020-05-27) https://doi.org/gg5tw3
DOI: 10.1101/2020.05.27.119438
86. Slide-seq: A scalable technology for measuring genome-wide expression at high spatial resolution
Samuel G. Rodriques, Robert R. Stickels, Aleksandrina Goeva, Carly A. Martin, Evan Murray, Charles R. Vanderburg, Joshua Welch, Linlin M. Chen, Fei Chen, Evan Z. Macosko Science (2019-03-29) https://doi.org/gfxpjk
DOI: 10.1126/science.aaw1219 · PMID: 30923225 · PMCID: PMC6927209
87. Highly multiplexed molecular and cellular mapping of breast cancer tissue in three dimensions using mass tomography
Raúl Catena, Alaz Özcan, Laura Kütt, Alex Plüss, Peter Schraml, Holger Moch, Bernd Bodenmiller, IMAXT Consortium Cold Spring Harbor Laboratory (2020-05-25) https://doi.org/gg87jf
DOI: 10.1101/2020.05.24.113571
88. ZipSeq: barcoding for real-time mapping of single cell transcriptomes
Kenneth H. Hu, John P. Eichorst, Chris S. McGinnis, David M. Patterson, Eric D. Chow, Kelly Kersten, Stephen C. Jameson, Zev J. Gartner, Arjun A. Rao, Matthew F. Krummel Nature Methods (2020-07-06) https://doi.org/gg87jd
DOI: 10.1038/s41592-020-0880-2 · PMID: 32632238
89. Orchestrating single-cell analysis with Bioconductor
Robert A. Amezquita, Aaron T. L. Lun, Etienne Becht, Vince J. Carey, Lindsay N. Carpp, Ludwig Geistlinger, Federico Marini, Kevin Rue-Albrecht, Davide Risso, Charlotte Soneson, … Stephanie C. Hicks Nature Methods (2019-12-02) https://doi.org/ggdxgx
DOI: 10.1038/s41592-019-0654-x · PMID: 31792435 · PMCID: PMC7358058
90. Integrating single-cell transcriptomic data across different conditions, technologies, and species
Andrew Butler, Paul Hoffman, Peter Smibert, Efthymia Papalexi, Rahul Satija Nature Biotechnology (2018-04-02) https://doi.org/gc87v6
DOI: 10.1038/nbt.4096 · PMID: 29608179 · PMCID: PMC6700744
91. The Human Tumor Atlas Network: Charting Tumor Transitions across Space and Time at Single-Cell Resolution
Orit Rozenblatt-Rosen, Aviv Regev, Philipp Oberdoerffer, Tal Nawy, Anna Hupalowska, Jennifer E. Rood, Orr Ashenberg, Ethan Cerami, Robert J. Coffey, Emek Demir, … Xiaowei Zhuang Cell (2020-04) https://doi.org/ggtkzd
DOI: 10.1016/j.cell.2020.03.053 · PMID: 32302568 · PMCID: PMC7376497
92. The Human Cell Atlas
Aviv Regev, Sarah A Teichmann, Eric S Lander, Ido Amit, Christophe Benoist, Ewan Birney, Bernd Bodenmiller, Peter Campbell, Piero Carninci, Menna Clatworthy, … Human Cell Atlas Meeting Participants eLife (2017-12-05) https://doi.org/gcnzcv
DOI: 10.7554/elife.27041 · PMID: 29206104 · PMCID: PMC5762154
93. The Human Cell Atlas: from vision to reality
Orit Rozenblatt-Rosen, Michael J. T. Stubbington, Aviv Regev, Sarah A. Teichmann Nature (2017-10-26) https://doi.org/gfgkr8
DOI: 10.1038/550451a · PMID: 29072289
94. Modern statistics for modern biology
Susan Holmes, Wolfgang Huber Cambridge University Press (2018)
ISBN: 9781108705295
95. Multi-Omics Data Integration and Mapping of Altered Kinases to Pathways Reveal Gonadotropin Hormone Signaling in Glioblastoma
Savita Jayaram, Manoj Kumar Gupta, Rajesh Raju, Poonam Gautam, Ravi Sirdeshmukh OMICS: A Journal of Integrative Biology (2016-12) https://doi.org/f9h7sd
DOI: 10.1089/omi.2016.0142 · PMID: 27930095
97. Multivariate analysis of multiblock and multigroup data
A. Eslami, E. M. Qannari, A. Kohler, S. Bougeard Chemometrics and Intelligent Laboratory Systems (2014-04) https://doi.org/f52wrr
DOI: 10.1016/j.chemolab.2014.01.016
98. Dimension reduction techniques for the integrative analysis of multi-omics data
Chen Meng, Oana A. Zeleznik, Gerhard G. Thallinger, Bernhard Kuster, Amin M. Gholami, Aedín C. Culhane Briefings in Bioinformatics (2016-07) https://doi.org/f83qvd
DOI: 10.1093/bib/bbv108 · PMID: 26969681 · PMCID: PMC4945831
 0000-0003-3923-1116
·
0000-0003-3923-1116
·  mixOmicsTeam
·
mixOmicsTeam
·  mixOmicsTeam